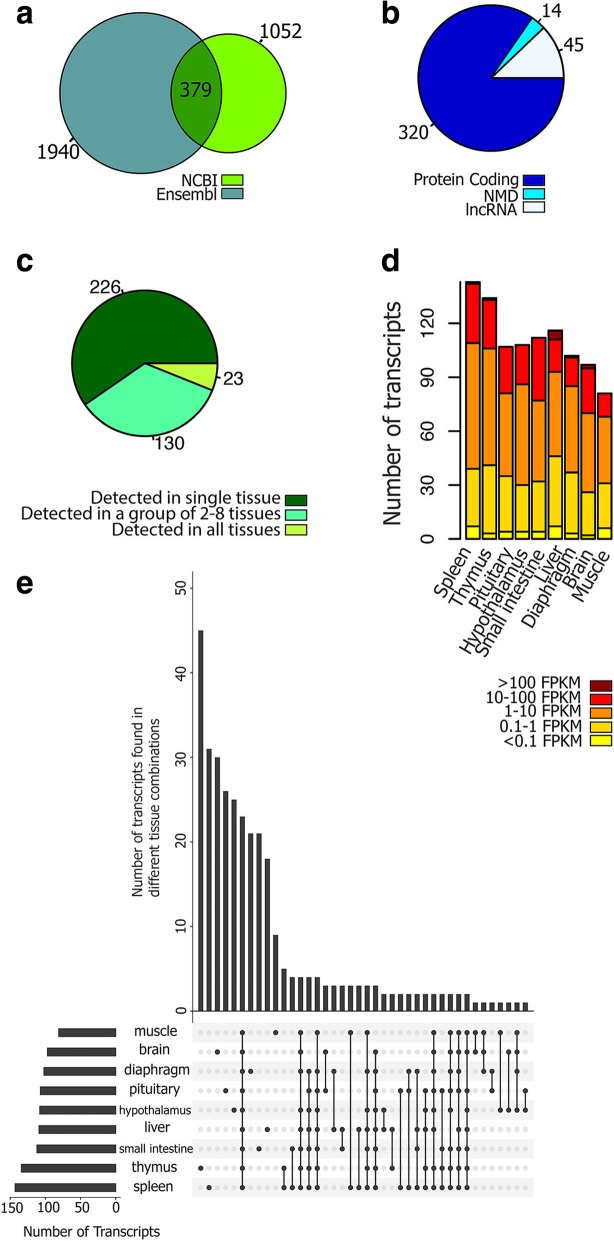
Fig. 10.
(a) Distribution of transcripts covering more than one known gene across Ensembl and NCBI annotations. (b) biotypes of transcripts with these structure in both Ensembl and NCBI annotations, their classification based on the number of detected tissues (c), their expression level in different tissues (d) and the number of transcripts detected in each tissue and their intersection with other tissues (e) using UpSetR [65]

