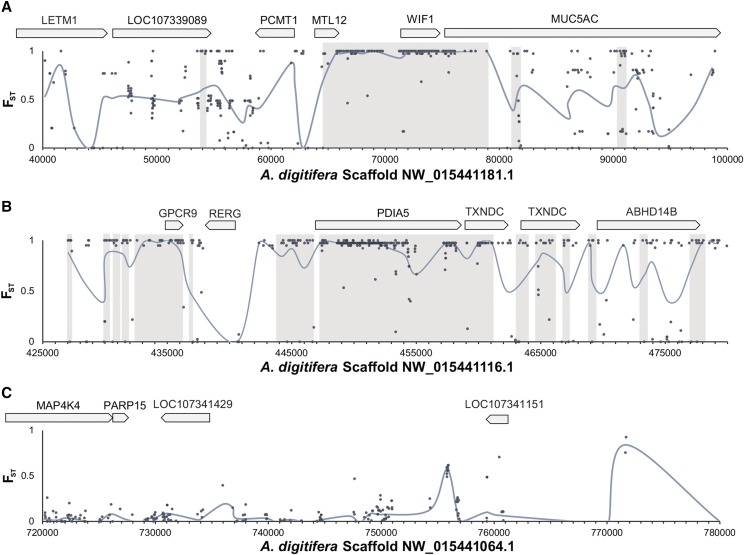
Figure 4.
Genomic intervals with or without regions of differentiation between A. palmata and A. cervicornis. Inter-species allelic differentiation (FST) was calculated using the unbiased Reich-Patterson estimator (Reich et al. 2009). High scoring regions are shaded in light gray along 60 kb genomic windows for the top two scoring intervals, scaffold NW_015441181.1 (A) and scaffold NW_015441116.1 (B), compared to 60 kb genomic window on scaffold NW_015441064.1 with no intervals (C). Gray points are the FST estimate for each SNVs and blue line is the average FST calculated over 1 kb sliding window analysis. Predicted genes within these windows are shown above the graph in gray arrows. In order, genes include mitochondrial proton/calcium exchanger protein (LETM1), A. digitifera LOC107339089, protein-L-isoaspartate (D-aspartate) O-methyltransferase (PCMT1), mitochondrial methyltransferase-like protein 12 (MTL12), Wnt inhibitory factor 1 (WIF1), mucin-5AC-like (MUC5AC), G protein-coupled receptor 9 (GPCR9), Ras-related and estrogen-regulated growth inhibitor (RERG), protein disulfide-isomerase A5 (PDIA5), thioredoxin domain containing protein (TXNDC), protein ABHD14B (ABHD14B), mitogen-activated protein kinase kinase kinase kinase 4 (MAP4K4), poly(ADP-ribose) polymerase family member 15 (PARP15), A. digitifera LOC107341429, and A. digitifera LOC107341151.

