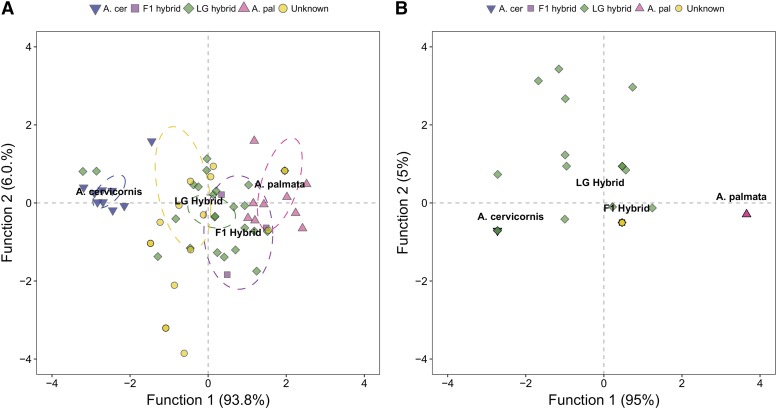
Figure 5.
Discriminant factorial correspondence analysis of five microsatellite markers (A) and eight species-specific SNV loci (B). Samples were assigned to four different groups based on their previous taxon assignment: 1. A. cervicornis (n = 9, blue upside down triangles), 2. A. palmata (n = 10, pink triangles), 3. F1 hybrids (n = 3, purple squares), and 4. later generation hybrids (n = 24, green diamonds). The remaining hybrid samples (n = 20, yellow circles) had no previous hybrid assignment and acted as our test set for the analysis. In panel B, multiple data points for pure bred colonies are not visible because their coordinates are identical. F1 hybrids, test hybrids and seven later generation hybrids are also masked as they share the same coordinates as the F1s, representing F1-like hybrids in the data set.

