Figure 1.
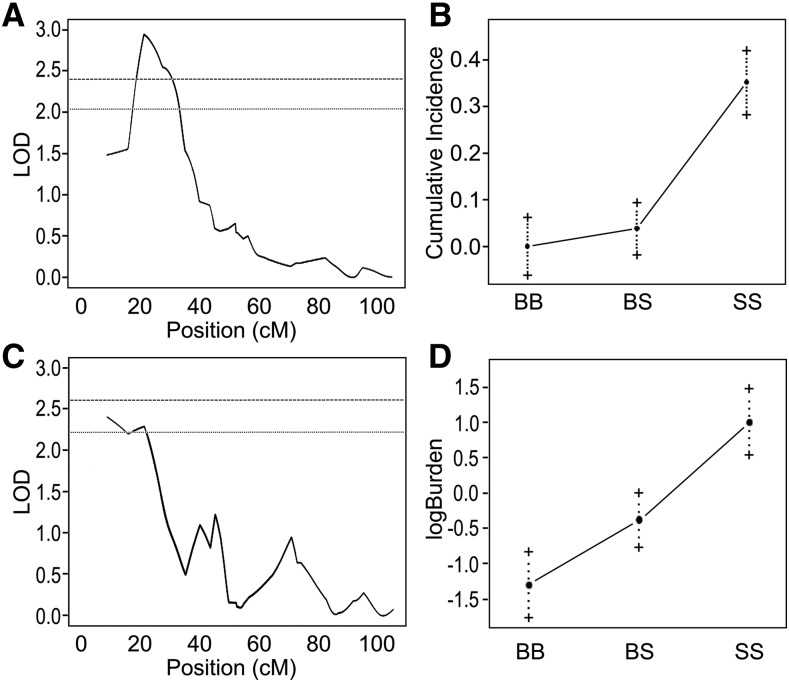
Interval mapping of mammary tumor incidence and burden in F2 progeny from a cross between SS and SS-5BN rats. Genotypes were determined at 25 polymorphic markers for 64 phenotypically defined F2 females. (A) Distribution of LOD scores for tumor incidence at 6 weeks post-exposure to DMBA identified a candidate region between 16.9 cM - 34.4 cM on RNO5. (B) A logistic regression with the peak marker in the candidate region revealed a significant association with tumor incidence at 6 weeks post-exposure to DMBA for the SS parental strain. (C) Distribution of LOD scores for tumor burden at 15 weeks post-exposure to DMBA identified an overlapping candidate region between 8.9 cM and 27.9 cM on RNO5. (D) A logistic regression with the peak marker in the candidate region revealed a significant association with tumor burden at 15 weeks post-exposure to DMBA. Lines indicate permutation-derived thresholds for significance at P = 0.05 (hashed lines) and P = 0.1 (dotted line).

