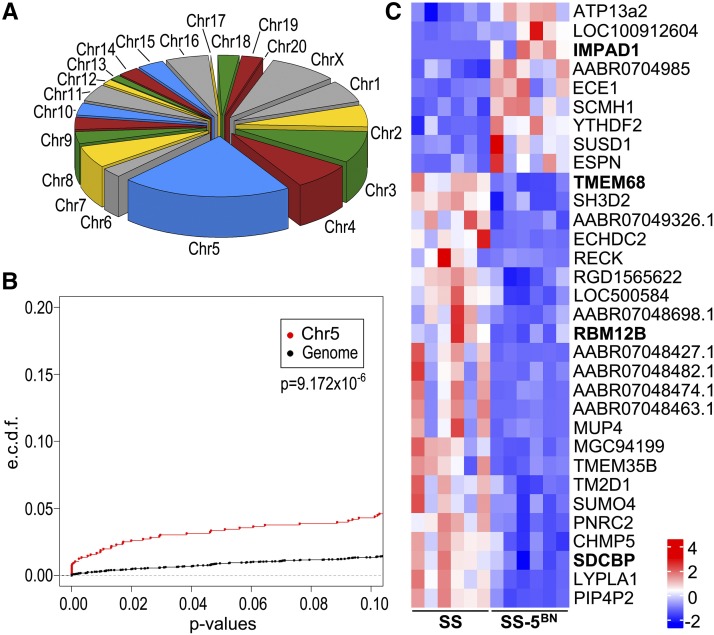
Figure 2.
RNAseq analysis of mammary tumors from SS and SS-5BN consomic rats (n = 6 per group). (A) Chromosomal distribution of the 155 differentially expressed genes in mammary tumors isolated fromSS and SS-5BN consomic rats. (B) Distributions of adjusted p-values for differentially expressed genes on RNO5 vs. the rest of the rat genome were tested by a two-sample Kolmogorov–Smirnov test. (C) Heatmap of differentially expressed genes that are localized to RNO5. Genes falling within the candidate region are labeled in bold.

