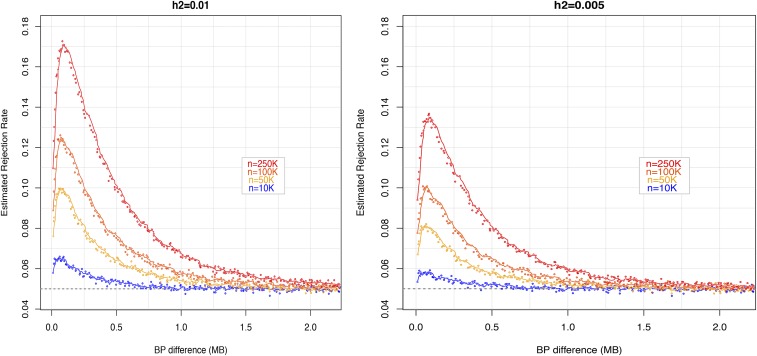
Figure 2.
Empirical rejection rates vs. distance between the QTL and the distal marker, by proportion of variance explained by the QTL (left and right panels) and sample size (curves). In the simulations, a single QTL () had an additive effect that explained either 1% (left) or 0.5% (right) of the phenotypic variance. The empirical model considered two SNPs with no causal effect. One of them () was adjacent to the QTL and the other one () was placed at increasing distance from the pair (). Rejection of the null hypothesis (no interaction between and was conducted at a 0.05 significance level. Empirical rejection rates above 0.05 are indicative of phantom epistasis.

