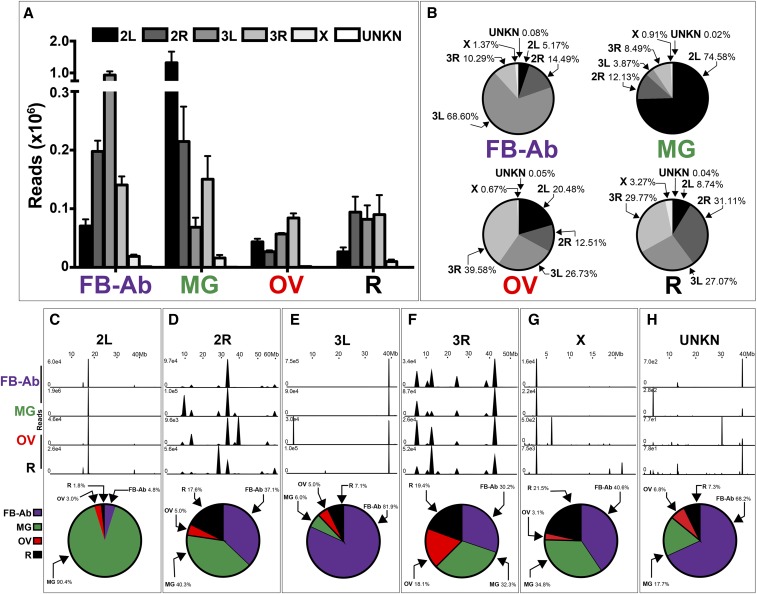
Figure 2.
Genome-wide mapping of annotated reads in An. gambiae mosquito tissues. (A-B) Chromosomal contribution of annotated reads to each tissue miRNA transcriptome. Data are graphed as (A) annotated read count and (B) percentage of annotated reads. (C-H) miRNA expression hot spots across chromosomes, (C) 2L, (D) 2R, (E) 3L, (F) 3R, (G) X, and (H) UNKN, for each tissue group, which include the percentage of tissue contribution to mapped annotated reads as graphed by pie graphs. Mosquito tissues include the Fat body-abdominal walls (FB-Ab, purple), Midgut (MG, green), Ovary (OV, red), and Remainder (R, black). This figure shows a representative from three biological replicates, with additional replicates available in (Figure S3). (A) values represent three biological replicates, and values are graphed as average +/− SEM. (B, C-H) Average values from three biological replicates were used for pie graphs.

