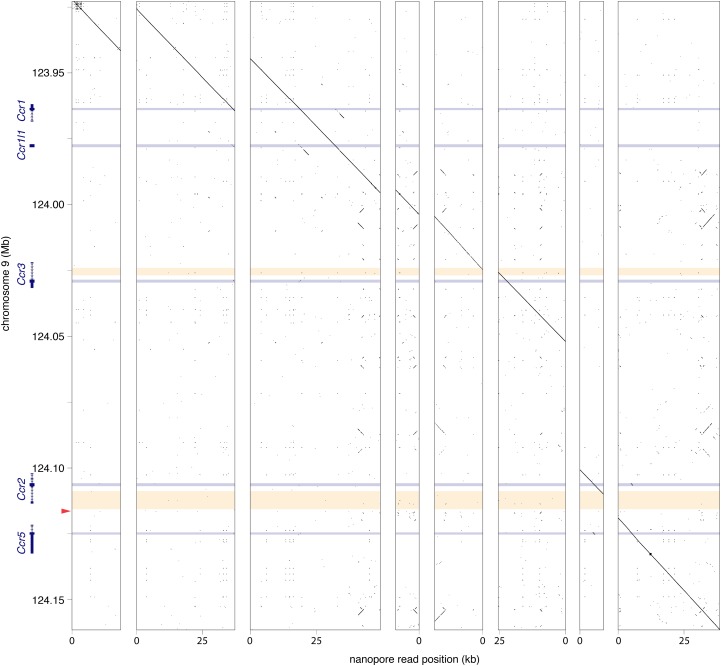
Figure 2.
Nucleotide dot plots with window size 15 nucleotides and step size one nucleotide. Blue horizontal bars: protein coding sequences; yellow horizontal bars: intragenic regions spanned by PCR assays (Supplemental Table 2); red arrowhead: Oct4:EGFP transgene integration site. Eight nanopore reads mapping to contig GL456153.2 on Chromosome 9. All genes adjacent to the transgene integration site (Ccr1, Ccr1l, Ccr3, Ccr2, and Ccr5) were present in our reads, and not disrupted by transgene insertion.

