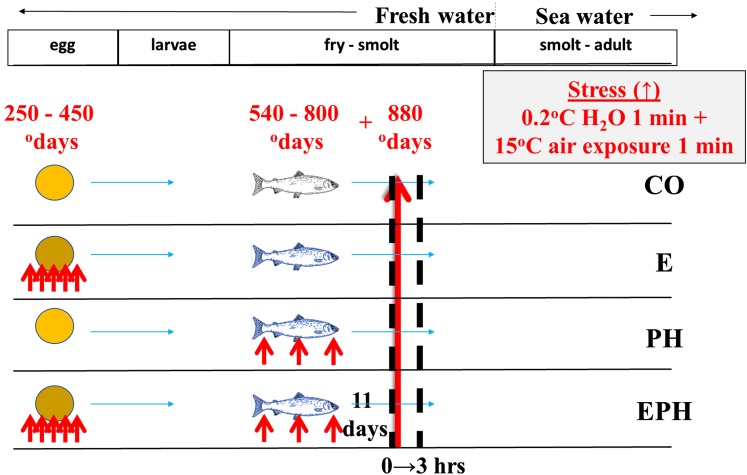
Figure 1.
Time course of experimental treatments and sampling for control (CO) embryonic (E) post hatch (PH) and embryonic post hatch (EPH) experimental treatments. Small red arrows indicate application of stresses for the three treatment groups (E, PH and EPH) and the large red arrow indicates the timing and application of the acute stress event to all experimental groups. Dashed black lines show when samples were taken for RRBS and RNA-seq.

