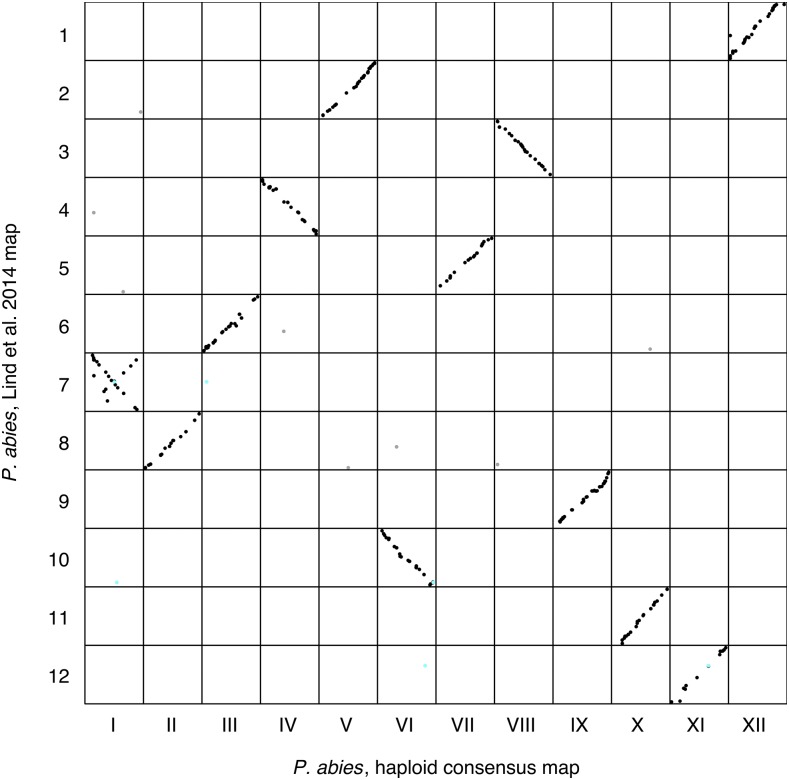
Figure 4.
Marker order comparison between Linkage Groups (LGs) from the haploid consensus map presented here and the Picea abies map from Lind et al. (2014). Consensus LG I - LG XII are located on the x-axis from left to right. Lind et al. LG 1 - LG 12 are located on the y-axis from top to bottom. Each dot represents a marker comparison from the same scaffold, where black coloration represents the LG where the majority of marker comparisons are mapped. Gray coloration represents markers mapping to a different LG compared to the majority of markers. Turquoise coloration represents markers located on split scaffolds, which are indicative of assembly errors.

