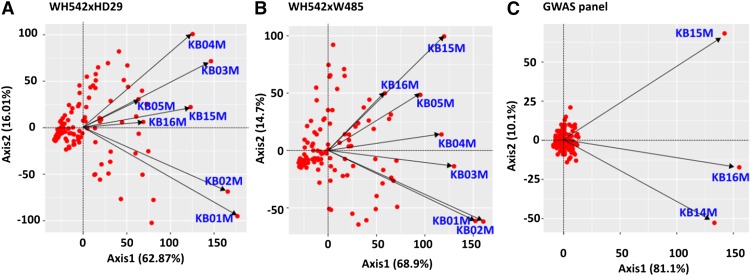
Figure 1.
Biplots showing the relationship between data sets for Karnal bunt resistance in (A) WH542×HD29, (B) WH542×W485, and (C) GWAS populations. Axis1 and Axis2 refer to principal components 1 and 2 respectively. The genotypes are represented as red-filled circles. Test environments KB01M, KB02M, KB03M, KB04M, and KB05M were years of experimental evaluations at Punjab Agricultural University, Ludhiana India, while KB14M, KB15M, and KB16M were experiments conducted at CIMMYT station in Obregon, Mexico.

