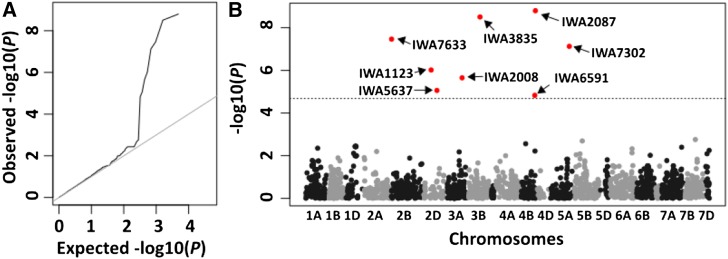
Figure 4.
Genome-wide scan for SNP markers associated with Karnal bunt resistance in an association mapping panel of commercial wheat varieties. The plots show: (a) QQplot of the observed P-value distribution, and (b) Manhattan plot of the identified loci above the significance threshold (broken line), with the chromosomes on the X-axis and the genome-wide scan –log10(P-values) on the Yaxis.

