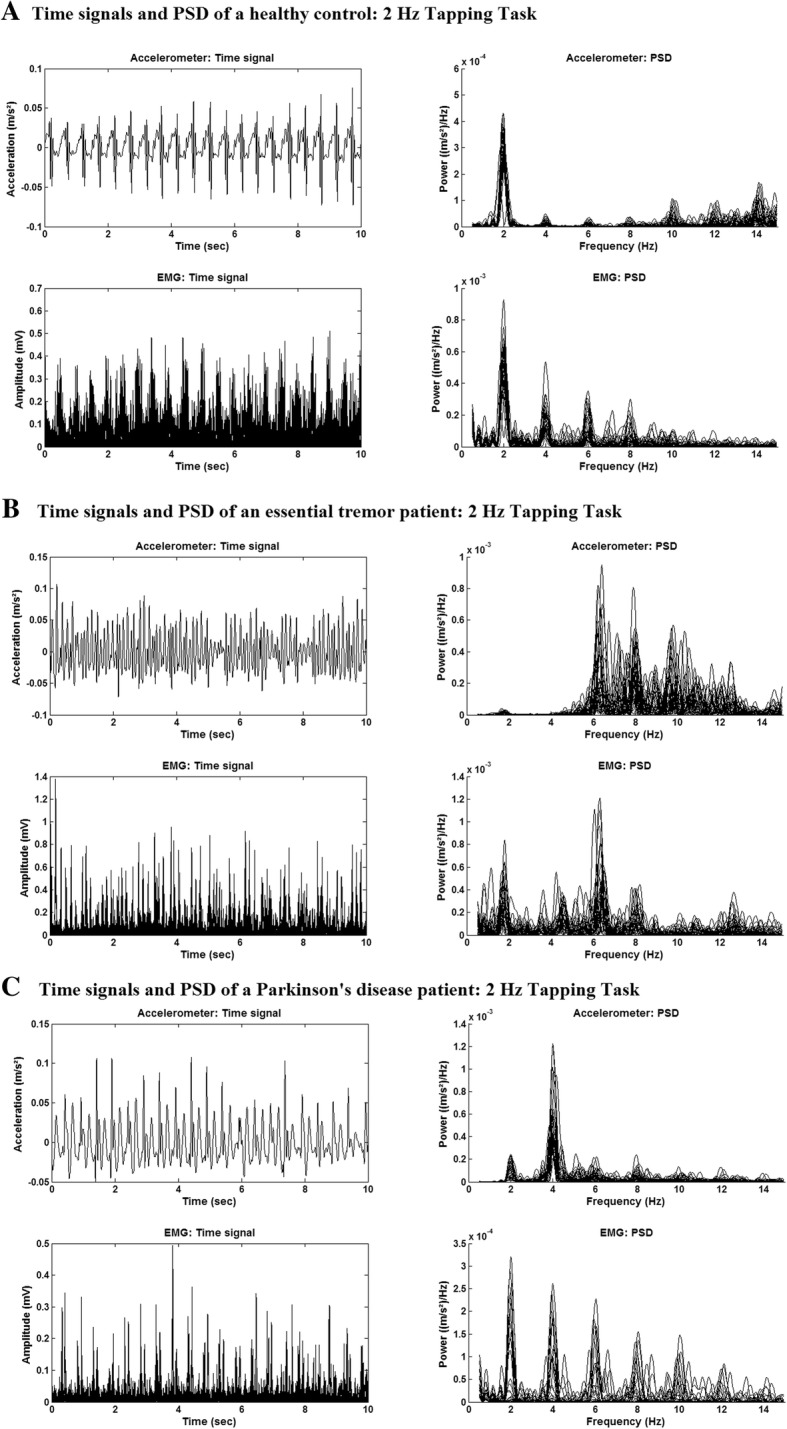
Fig. 1.

Example of the time signal and corresponding power spectral density. Time signal (10 s) and power spectral density (PSD) (of all epochs) of the EMG (top) and accelerometer (bottom) data. Time signals are presented in the left figure and the PSD in the right Fig. a) Data are of a representative healthy subject. b) Data are of an ET patient with high power kinetic tremor at 6 Hz. c) Data are of a PD patient with high power kinetic tremor at 4 Hz
