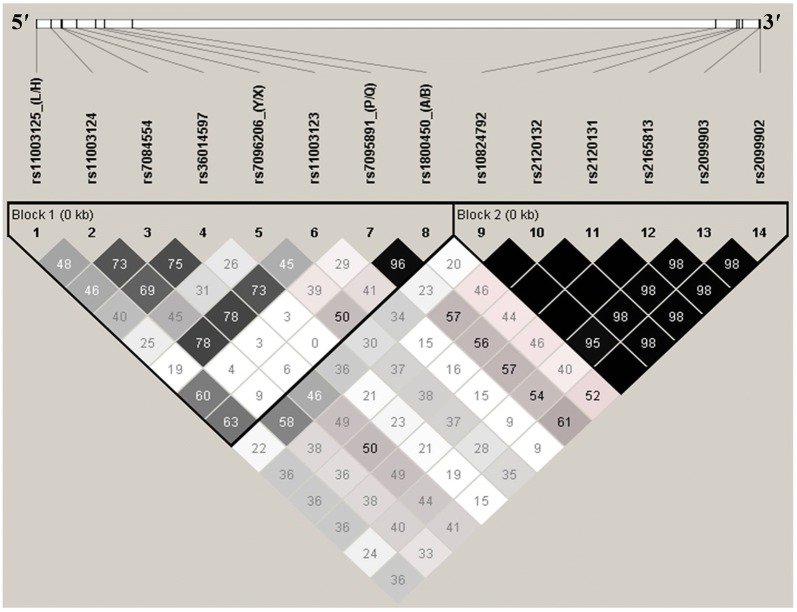
Fig. 2.
LD pattern of MBL2 variants in all participants. Block 1 represents the 5′ block variants. Block 2 represents the 3′ block variants. D′ is scaled between white diamond: D′ = 0 i.e. complete Linkage equilibrium, shades of grey: 0 < D′ < 1, Black diamond: D′ = 1 i.e. complete LD. Numbers in diamonds are D′-value expressed as a percentile. Black diamond without numbers represents a D′ of 100

