Fig. 1.
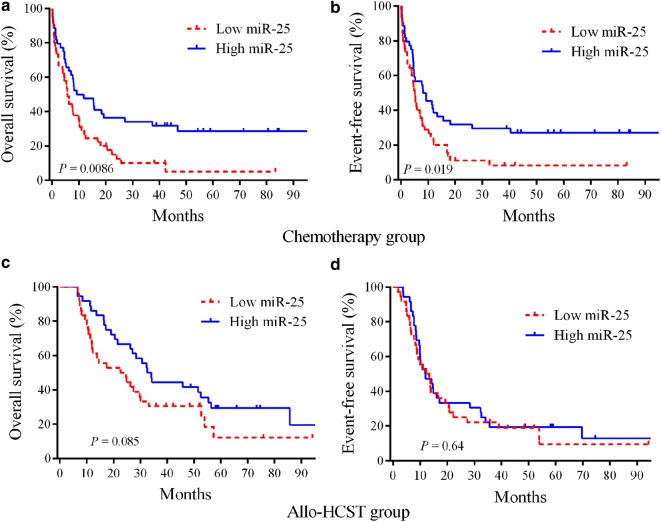
Kaplan–Meier survival curves of AML patients stratified based on miR-25 expression. a, b In the chemotherapy group, the high miR-25 expressers had significantly prolonged OS and EFS (n = 90) compared with low miR-25 expressers. c, d There were no significant differences in patients undergoing allo-HSCT between high and low miR-25 groups (n = 72)

