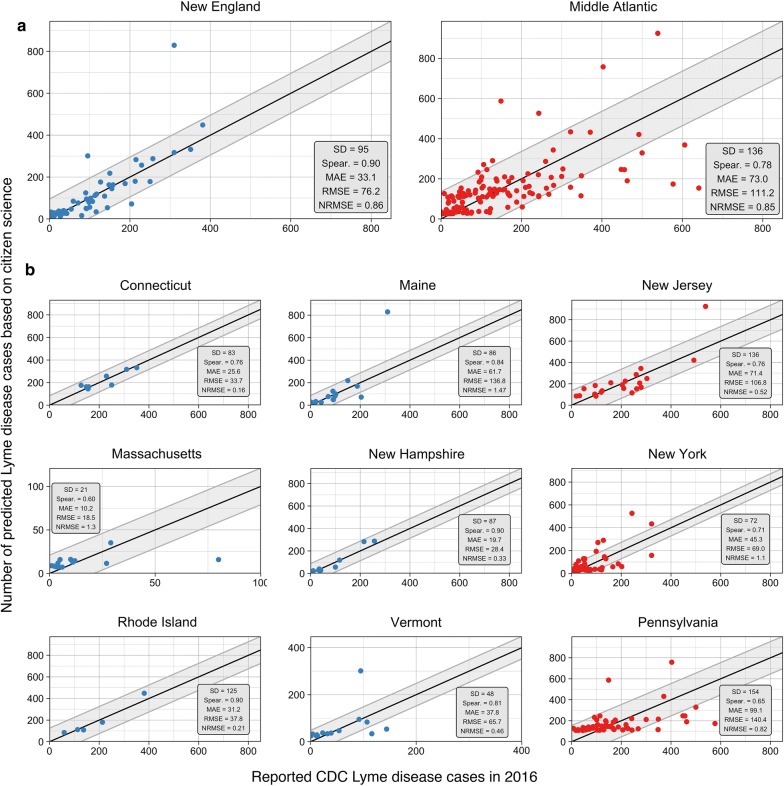
Fig. 6.
Performance of CS based model predictions by division (a) and state (b) compared to actual CDC reported Lyme disease cases in 2016. Three elements have been included to improve interpretation: (1) 1:1 black line indicating a perfect model; (2) grey ribbon indicating one standard deviation of the reported Lyme disease cases from the 1:1 line; and (3) points colored based on division (New England = blue, Middle Atlantic = red)

