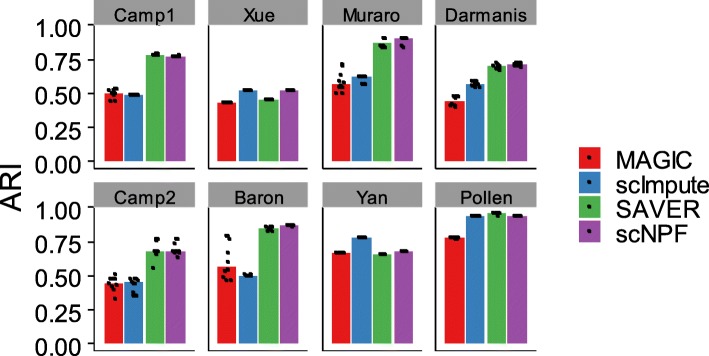
Fig. 2.
Benchmarking of scNPF-propagation on eight published scRNA-seq data sets.Clustering is performed by applying a consensus clustering method called SC3 on the imputed expression matrices. SC3 clustering is repeated for 10 times. Each dot represents an individual SC3 clustering run and each bar represents the median performance. ARI is employed to measure the concordance between inferred and true cluster labels. Detailed information of the data sets is shown in Additional file 2: Table S1

