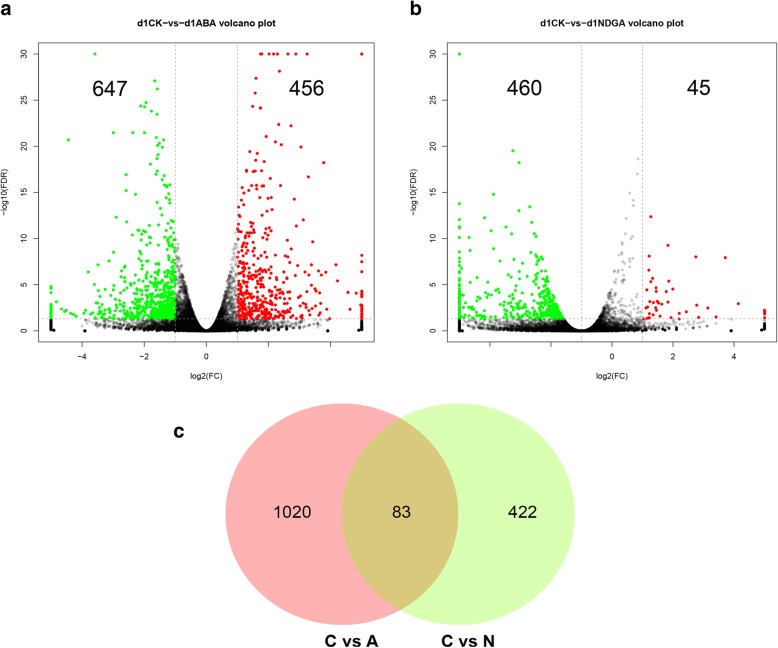
Fig. 7.
Identification of DEGs in response to ABA and NDGA treatment at 1 DAT. a. Volcano plot analysis between the control (C) and ABA (A)-treated fruit. The green plot indicates the downregulated transcripts, and the red plot represents the upregulated transcripts. The threshold for DEGs was set at a fold change ≥2 and an FDR ≤ 0.05. b. Volcano plot analysis between the control (C) and NDGA (N)-treated fruit. c. Venn diagram showing the number of specific and common DEGs between the ABA and NDGA treatments

