
Figure 1.
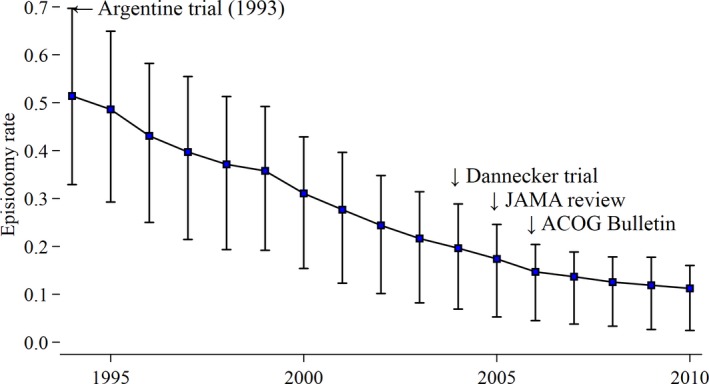
Average and interquartile range of physician‐level episiotomy rates for routine vaginal deliveries. The trendline depicts average physician‐level episiotomy rates. Bars represent the 25th and 75th percentiles of physician‐level rates [Color figure can be viewed at wileyonlinelibrary.com]