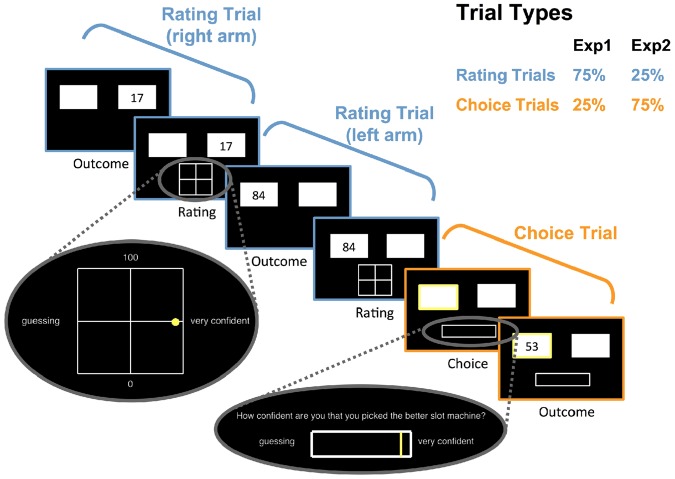
Figure 1.
Schematic representation of the task structure, showing a typical sequence of trials: people were faced with both rating (blue) and choice (orange) trials. During rating trials, they observed outcomes randomly from one arm of the two-armed bandit, represented as squares. Participants then rated the average value of this arm and their confidence in this value-belief estimate on a 2D grid. During choice trials, participants freely chose one arm of the bandit, rated their confidence in this decision and were then shown the reward. In Experiment 1, 75% of trials were rating trials and 25% trials were choice trials, with both trial types intermixed randomly. In Experiment 2, these proportions were reversed.

