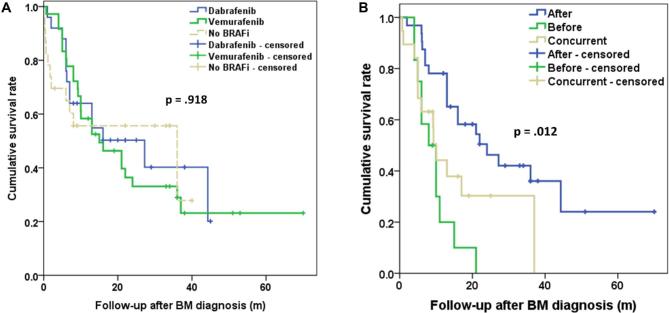
FIGURE 3.
A, Kaplan–Meier curves demonstrating survival after the diagnosis of BM in relation to use of BRAF inhibitor and type of BRAF inhibitor used. B, Kaplan–Meier curves demonstrating survival after the diagnosis of BM depending on timing of BRAF inhibitor administration in relation to SRS treatment.

