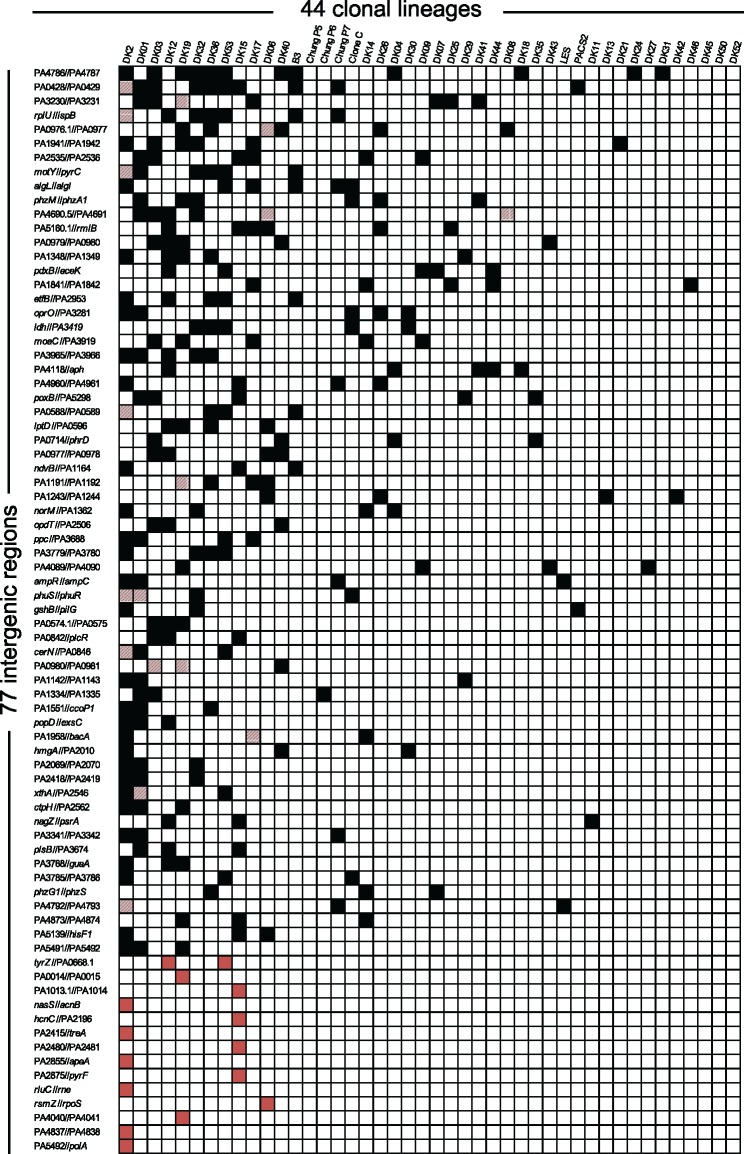
Fig. 2.
—A matrix showing 77 intergenic regions targeted by adaptive mutations across or within 44 clonal lineages. The black squares in the matrix show the intergenic regions where adaptive mutations were present in a single isolate of a respective clonal lineage and in isolates from other clonal lineages. The red squares in the matrix show the intergenic regions with adaptive mutations present only within isolates of a single respective clonal lineage. Squares with striped red color indicate intergenic regions in which adaptive mutations occurred both within isolates of a respective clonal lineage and in isolates from other clonal lineages.

