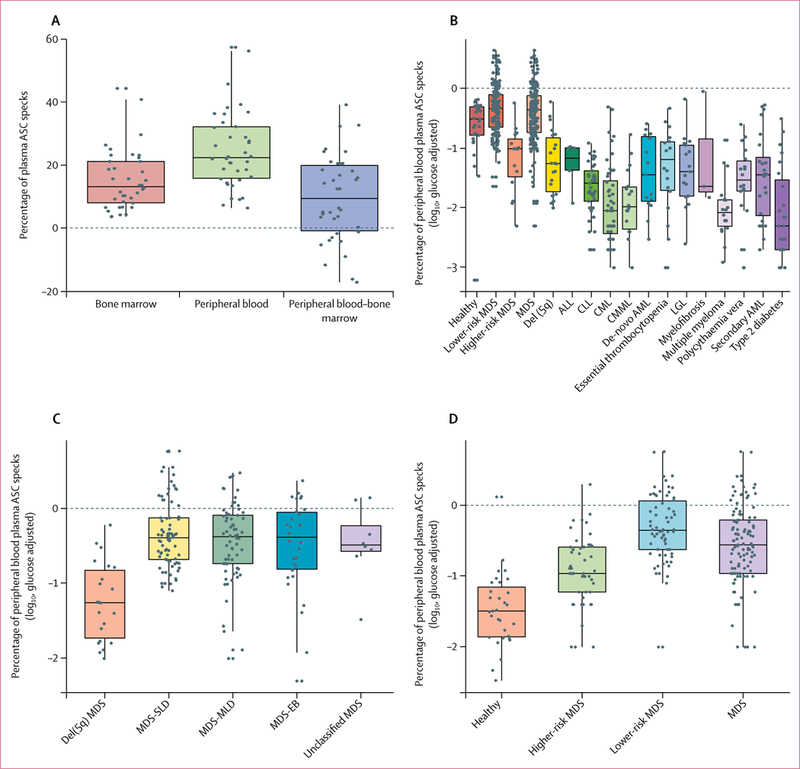
Figure 2: Quantification of ASC specks in bone marrow and peripheral blood from patients with myelodysplastic syndromes relative to patients with other haematological cancers, type 2 diabetes, or healthy donors.

ASC=apoptosis-associated speck-like protein containing a CARD. MDS=myelodysplastic syndromes. del(5q)=chromosome 5 deletion. ALL=acute lymphocytic leukaemia. CLL=chronic lymphocytic leukaemia. CML=chronic myelogenous leukaemia. CMML=chronic myelomonocytic leukaemia. AML=acute myeloid leukaemia. LGL=large granular lymphocytic leukaemia. SLD=single-lineage dysplasia. MLD=multilineage dysplasia. EB=excess blasts. Boxes show median (centre line) and IQR (outer lines) and whiskers show SD. (A) Glucose-adjusted percentage of ASC specks in bone marrow and peripheral blood plasma, and difference between peripheral blood and bone marrow in samples from patients with myelodysplastic syndromes in the discovery cohort, quantified by flow cytometry. (B) Glucose-adjusted log10-transformed percentage of ASC specks in peripheral blood plasma from healthy controls and patients with myelodysplastic syndromes in the discovery cohort, as well as patients with non-myelodysplastic syndrome haematological cancers and type 2 diabetes, quantified by flow cytometry. (C) Glucose-adjusted log10-transformed percentage of ASC specks quantified by flow cytometry in patients with different subtypes of myelodysplastic syndromes from the discovery cohort and patients with del(5q) mutation, as categorised by 2016 WHO guidelines. (D) Glucose-adjusted log10-transformed percentage of ASC specks quantified by flow cytometry in peripheral blood plasma samples from patients with myelodysplastic syndromes versus healthy controls in the validation cohort.
