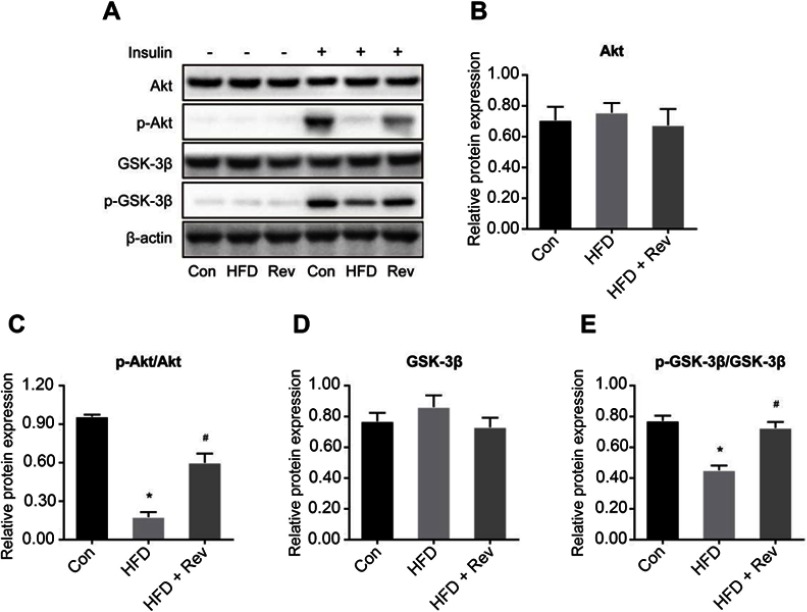
Figure 5.
Relative proteins expression of insulin signaling pathway after resveratrol treatment. (A). Protein bands of insulin signaling pathway molecules. (B–E). Densitometric analysis of protein expression. (B). Akt. (C). p-Akt. (D). GSK-3β. (E). p-GSK-3β. Data are presented as the mean ± SD (n=3). One-way ANOVA was used for statistical analysis followed by a post hoc least significant difference test or Tamhane’s multiple comparison test. *P<0.05 vs Con group. #P<0.05 vs HFD group.
Abbreviations: Akt, protein kinase B; Con, control group; GSK-3β, glycogen synthase kinase 3 beta; HFD, high-fat diet group; HFD + Rev, high-fat diet + resveratrol group.

