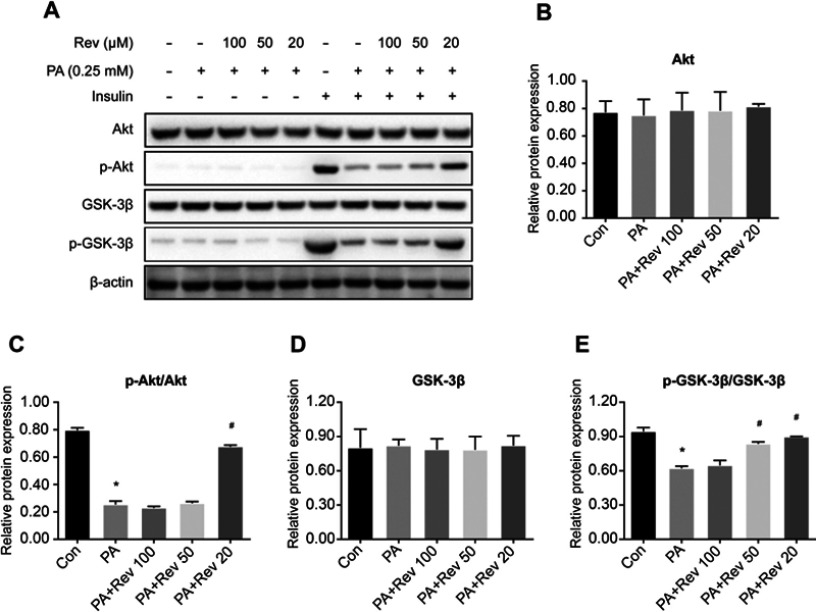
Figure 8.
Relative protein expression of insulin signaling pathway in control, palmitic acid and different concentrations of resveratrol groups. (A). Protein bands of insulin signaling pathway molecules. (B–E). Densitometric analysis of protein expression. (B). Akt. (C). p-Akt. (D). GSK-3β. (E). p-GSK-3β. Data are presented as the mean ± SD (n=3). One-way ANOVA was used for statistical analysis followed by a post hoc least significant difference test or Tamhane’s multiple comparison test. *P<0.05 vs Con group. #P<0.05 vs PA group.
Abbreviations: Akt, protein kinase B; Con, control group; GSK-3β, glycogen synthase kinase 3 beta; PA, palmitic acid group; PA + Rev 100, palmitic acid + resveratrol 100 μM group; PA + Rev 50, palmitic acid + resveratrol 50 μM group; PA + Rev 20, palmitic acid + resveratrol 20 μM group.

