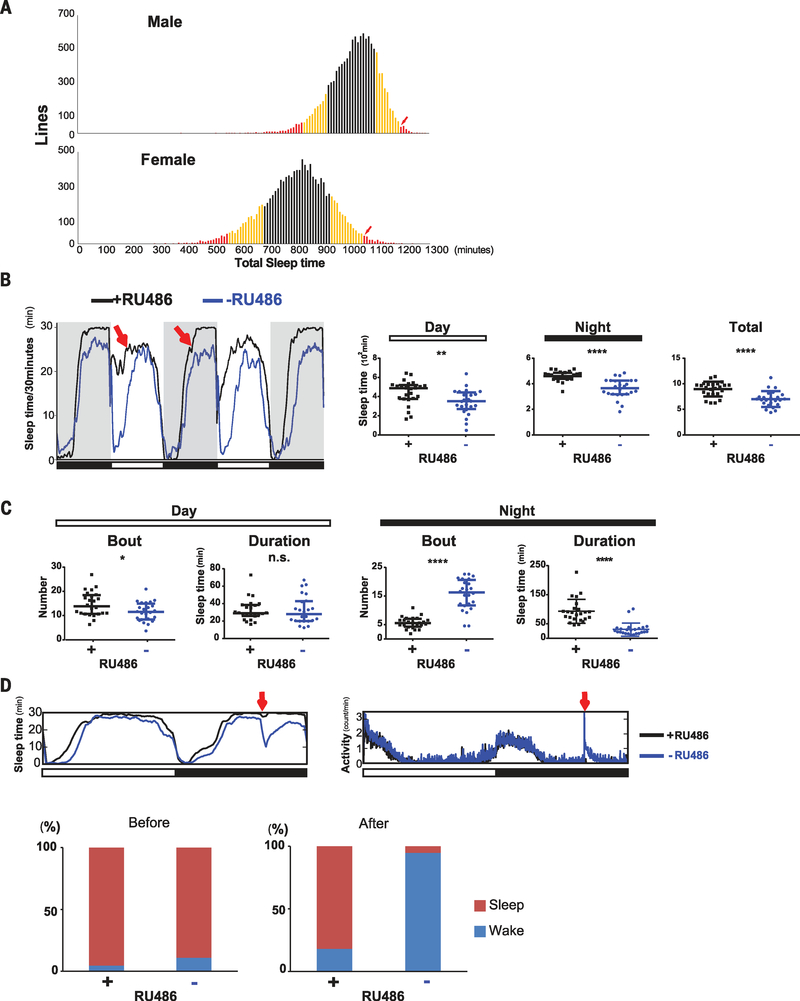
Fig. 1. nemuri (nur) overexpression promotes sleep.
(A) Summary of the gain-of-function screen. A UAS insertion in each line was driven by elav-GS, which was induced by adding RU486 to the food. Average sleep time (minutes per 24 hours; x axis) is shown for males (top) and females (bottom). Lines within one standard deviation (SD) of the average sleep time are indicated in black, one to two SDs in yellow, and two or more SDs in red. An arrow indicates the line termed nemuri. (B) Left: Sleep profile of elav-GS/UAS-nemuri flies +RU486 (black) or −RU486 (blue) obtained by video tracking. Red arrows indicate longer sleep in the presence of RU486 (black line) in nur-overexpressing flies. Right: Median ± interquartile minutes of sleep during daytime, night, and total 24-hour period in +RU486 flies versus vehicle controls; n = 24 females for each group. **P < 0.01, ****P < 0.0001 (Mann-Whitney U test). (C) Sleep architecture assayed through video tracking. Median ± interquartile number of sleep bouts and bout duration is shown for the daytime (left) and night (right) in +RU486 flies and vehicle controls; n = 24 females for each group. *P < 0.05, ****P < 0.0001 (Mann-Whitney U test); n.s., not significant. (D) Top: Sleep/wake patterns in the Drosophila activity monitoring system of flies subjected to a mechanical stimulus at ZT20 (red arrow). Sleep (left) and activity (right) are shown for nur overexpressors (black) and control (blue) flies (n = 32 females per group). Bottom: Bar graphs indicate the percentage of RU486-treated (+) or control (−) flies in sleep (red) versus wake (blue) states, before (left) and after (right) the stimulus.

