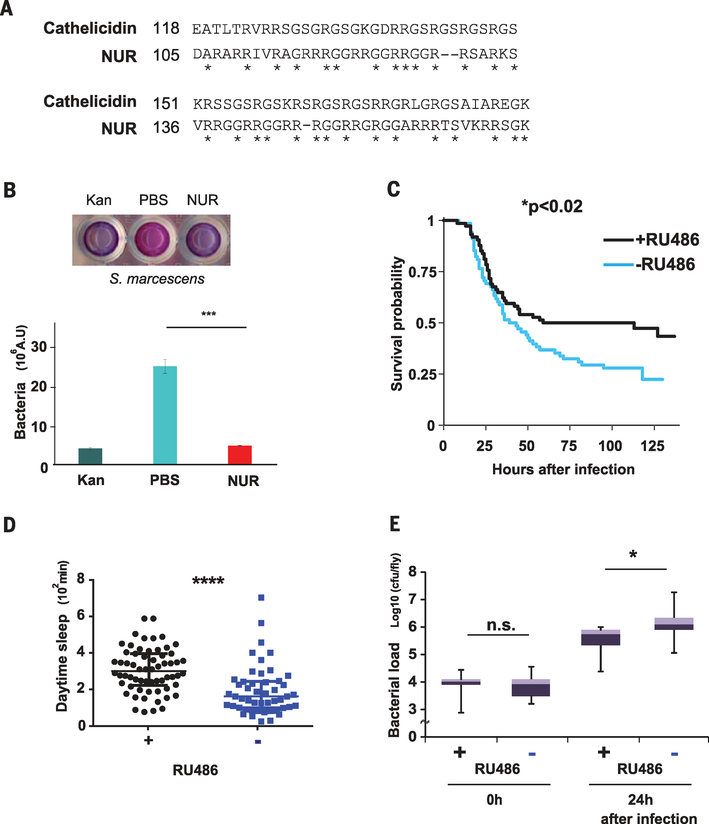
Fig. 3. nur encodes an antimicrobial peptide that promotes survival upon expression in neurons.
(A) Alignment between NUR and a fish cathelicidin. The C-terminal domain of NUR shows sequence similarity with a Greenland cod (Gadus ogac) cathelicidin. Note the overlap of glycine and arginine residues, indicated by asterisks. Amino acid abbreviations: A, Ala; D, Asp; E, Glu; G, Gly; I, Ile; K, Lys; L, Leu; R, Arg; S, Ser; T, Thr; V, Val. (B) Top: Alamar Blue cell viability assay; S. marcescens in PBS alone (center), with kanamycin (left), or with NUR protein (right). Blue color indicates lack of bacteria. Bottom: The assay was quantified by measuring absorbance at 595 nm (n = 3). ***P < 0.001 (Student t test). Error bars denote SEM. (C) Kaplan-Meier plot depicting survival of infection with S. marcescens in nur-overexpressing flies (+RU486) and controls (−RU486); n = 68 and 74 females, respectively. *P < 0.02 (log rank test). (D) Daytime sleep in nur-overexpressing flies (black) and controls (blue) after infection at ZT18 the previous night; n = 49 control and 62 +RU486-fed female flies, respectively. Median ± interquartile is shown. ****P < 0.0001 (Mann-Whitney U test). Note that daytime sleep values are lower than in other figures (fig. S1B). This effect was also observed in uninfected controls and may be caused by the CO2 anesthesia necessary for infecting flies. (E) Bacterial load in control flies (−) and nur overexpressors (+) at indicated times after infection; n = 9 for each. Median ± interquartile is shown; cfu, colony-forming units. *P < 0.05 (Mann-Whitney U test).

