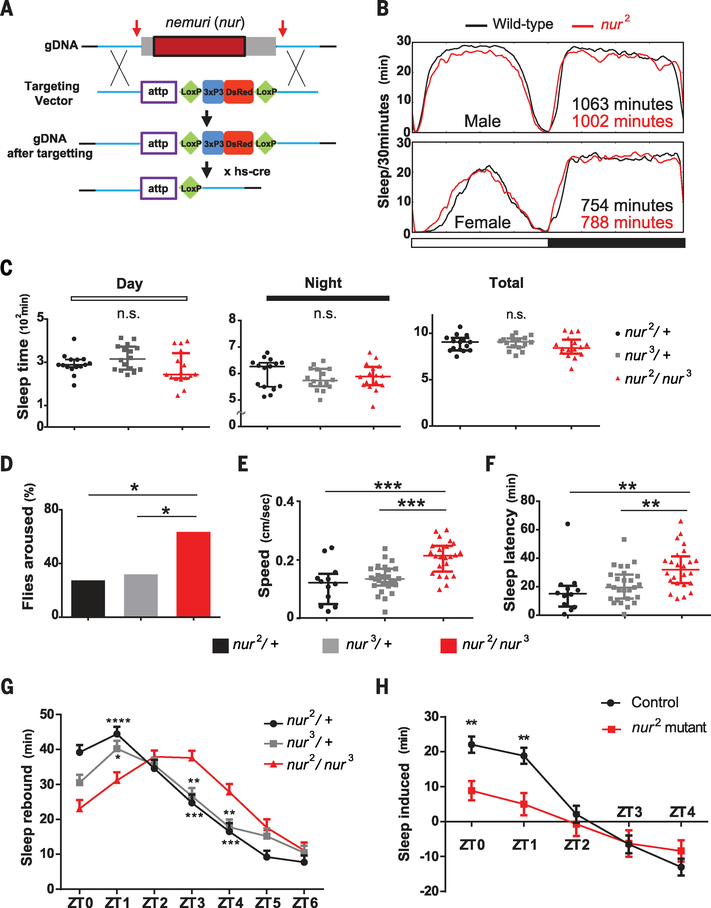
Fig. 4. Requirement of nur for sleep depth and for acute sleep induction after sleep deprivation or infection.
(A) Gene targeting to knock out nur using CRISPR/Cas9. Arrows indicate regions targeted by guide RNA. Homology arms (~1 kbp; blue) are flanked by attp-Loxp-3xP3 (eyeless promoter)–DsRed-Loxp sequences. After the targeting, hs-cre was crossed in to flip out the Loxp-3xP3-DsRed-LoxP sequence. (B) Sleep pattern of nur2 mutants or wild-type controls (iso31) in males and females. Horizontal white and black bars correspond to light and dark cycles. (C) Day, night, and total sleep in the genotypes indicated; n = 15, 16, and 16 females for nur2/+, nur3/+, and nur2/nur3, respectively. Median ± interquartile is shown in all cases. P > 0.05 (Mann-Whitney U test). (D) Arousal threshold assay using a light pulse of 10 s in the middle of the night. Shown are proportions of flies awakened by the stimulus; n = 44, 54, and 73 females for nur2/+, nur3/+, and nur2/nur3, respectively. *P < 0.05 (Fisher exact test). (E and F) Speed after awakening (E) and latency to sleep (F) of flies awakened by light stimuli in (D). Speed in (E) was measured by video tracking after awakening until they fell asleep again. Median ± interquartile is shown; n = 12, 27, and 24 females for nur2/+, nur3/+, and nur2/nur3, respectively. ***P < 0.001, **P < 0.01 (Kruskal-Wallis test with Dunn post hoc comparison). (G) Recovery sleep after 6 hours of sleep deprivation. Rebound was calculated as the mean ± SEM net change in sleep relative to the baseline day before deprivation; n = 64 females for each genotype. (H) Infection-induced sleep, calculated as the mean ± SEM net change in sleep in the morning after infection relative to the corresponding baseline; n = 45 and 37 females for W1118 control and nur2 homozygous mutants, respectively. In (G) and (H), sleep values are plotted against zeitgeber time. *P < 0.05, **P < 0.01, ***P < 0.001, ****P < 0.0001 (two-way analysis of variance followed by Bonferroni multiple comparison test).

