Fig. 7.
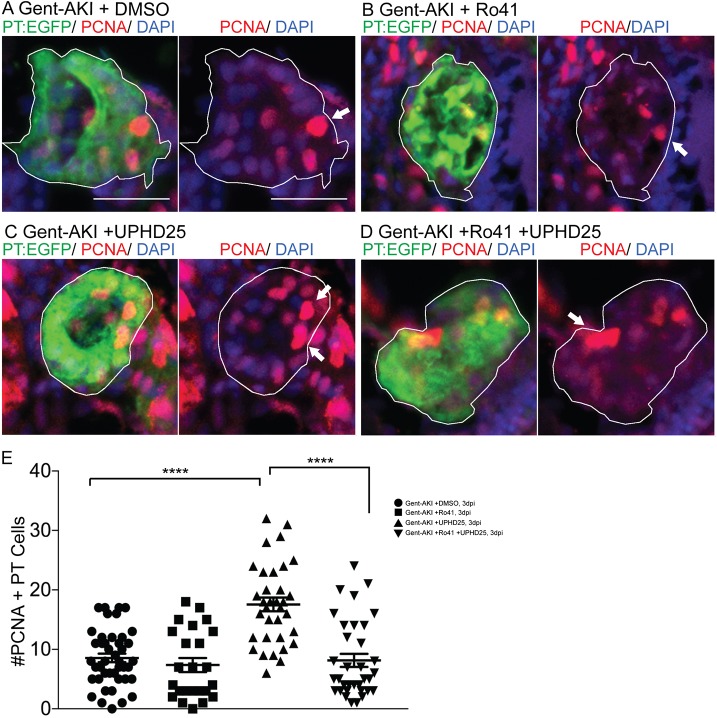
UPHD25 treatment efficacy requires intact RA signaling. Tg(PT:EGFP) transgenic zebrafish were used to analyze RTEC proliferation. (A-D) Immunofluorescence stain showing cells actively undergoing S-phase marked with PCNA antibody (red) and PT (green) in gent-AKI+DMSO (A), gent-AKI+Ro41 (B), gent-AKI+UPHD25 (C) and gent-AKI+Ro41+UPHD25 (D). PTs are outlined in white and arrows mark PCNA+ RTECs. (E) Quantification of PCNA+ RTECs in each treatment group. MeanUPHD25=17.56 (N=34) vs MeanRo41+UPHD25=8.15 (N=34). Data pooled from three biological replicates are shown expressed as mean±s.e.m. One-way ANOVA: ****P<0.001. Scale bars: 20 μm.

