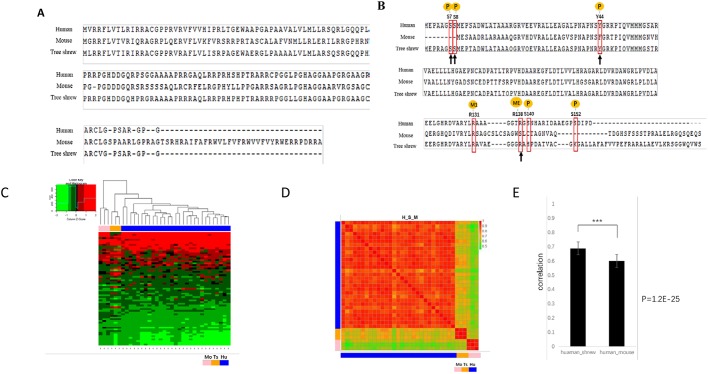
Fig. 6.
Comparisons of human, tree shrew and mouse pancreatic cancer models. (A) Homology comparison of ARF (encoded by Cdkn2a) among human, mouse and tree shrew. The homology of tree shrew to human was significantly higher than that of mouse to human. (B) Post-translational modification sites of P16Ink4a are outlined with red boxes, and the conserved sites in tree shrew, but not in mouse, are indicated by black arrows. ME, methylation; M1, mono-methylation; P, phosphorylation. (C) Pairwise comparisons of gene expression profiles of tree shrew, human and mouse PDAC. Dendrogram showing distinct clusters for the tree shrew, human and mouse samples. (D) Heat map illustrating the correlation between expression profiles of the three species. Hu, human; Mo, mouse; Ts, tree shrew. (E) Bar graph illustrating the average correlation among the three species; error bars represent s.d. ***P=1.25×10⁻²⁵.

