Fig. 1.
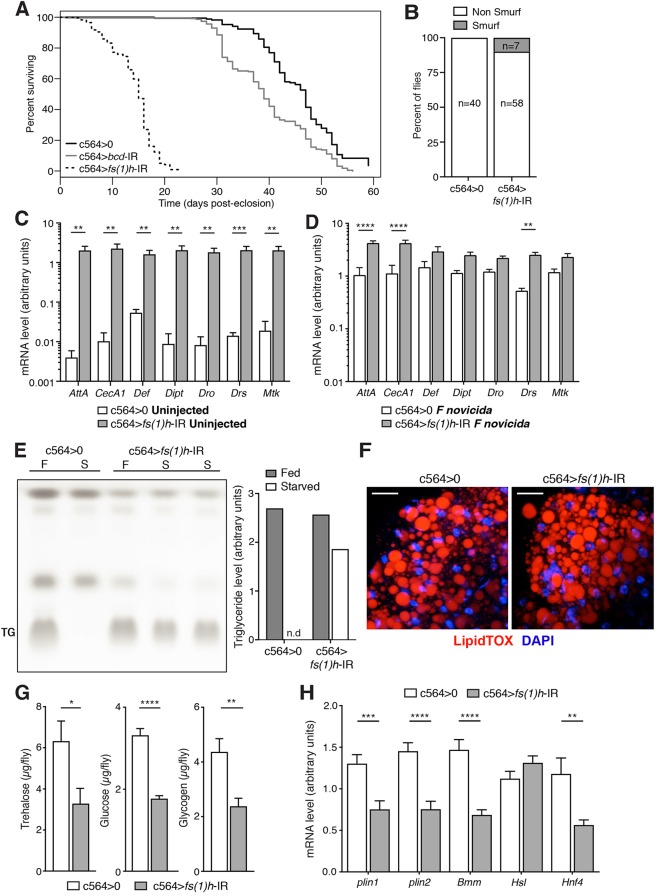
fs(1)h is required in fat body for normal lifespan, immune gene expression and physiology. (A) Survival of male flies with fat-body fs(1)h knockdown (c564>fs(1)h-IR), an irrelevant knockdown (c564>bcd-IR) and driver-only controls (c564>0) at 25°C. (Here and in all other cases, flies are on a w1118 genetic background; ‘c564>0’ indicates the driver-only control line, in which Gal4 is expressed but no knockdown is present.) Number of flies: c564>0, n=178; c564>bcd-IR, n=235; c564>fs(1)h-IR, n=230. (B) Smurf assay of gut integrity in 5- to 7-day-old fs(1)h knockdowns and wild-type controls. Number of flies: c564>0, n=40; c564>fs(1)h-IR, n=65. Values are statistically different by Fisher's exact test (P=0.0424). (C,D) Expression of antimicrobial peptide (AMP) genes in isolated fat body from 5- to 7-day-old male control (c564>0) and fat-body fs(1)h knockdown (c564>fs(1)h-IR) flies. Normalised to expression of α-tubulin as a loading control; here and elsewhere, graphed qRT-PCR values are these tubulin-normalised abundance measurements. Values shown as mean+s.e.m. (C) Uninjected flies. (D) Francisella novicida-injected flies. (E) Triglyceride (TG) levels in control and fat-body fs(1)h knockdown flies under normal conditions and following 24-h starvation (F, fed; S, starved; n.d., no TG detected). Values shown as mean. (F) Isolated fat-body tissue from fs(1)h knockdowns and controls, stained with LipidTOX (red; TG) and DAPI (blue; nuclei). Scale bars: 20 μm. Representative of eight flies per genotype. (G) Free sugar (trehalose and glucose) and stored carbohydrate (glycogen) levels in controls and fs(1)h fat-body-knockdown flies. Values represent six replicates per genotype. Shown as mean+s.e.m.; genotypes were compared using unpaired two-tailed t-test. (H) Expression of plin1, plin2, Bmm, Hsl and Hnf4 in isolated fat body from control and fs(1)h fat-body-knockdown flies. Normalised to expression of α-tubulin as a loading control. Values shown as mean+s.e.m.; genotypes were compared using unpaired, two-tailed t-test. 8-10 samples per genotype. Throughout, *P<0.05, **P<0.01, ***P<0.001, ****P<0.0001.

