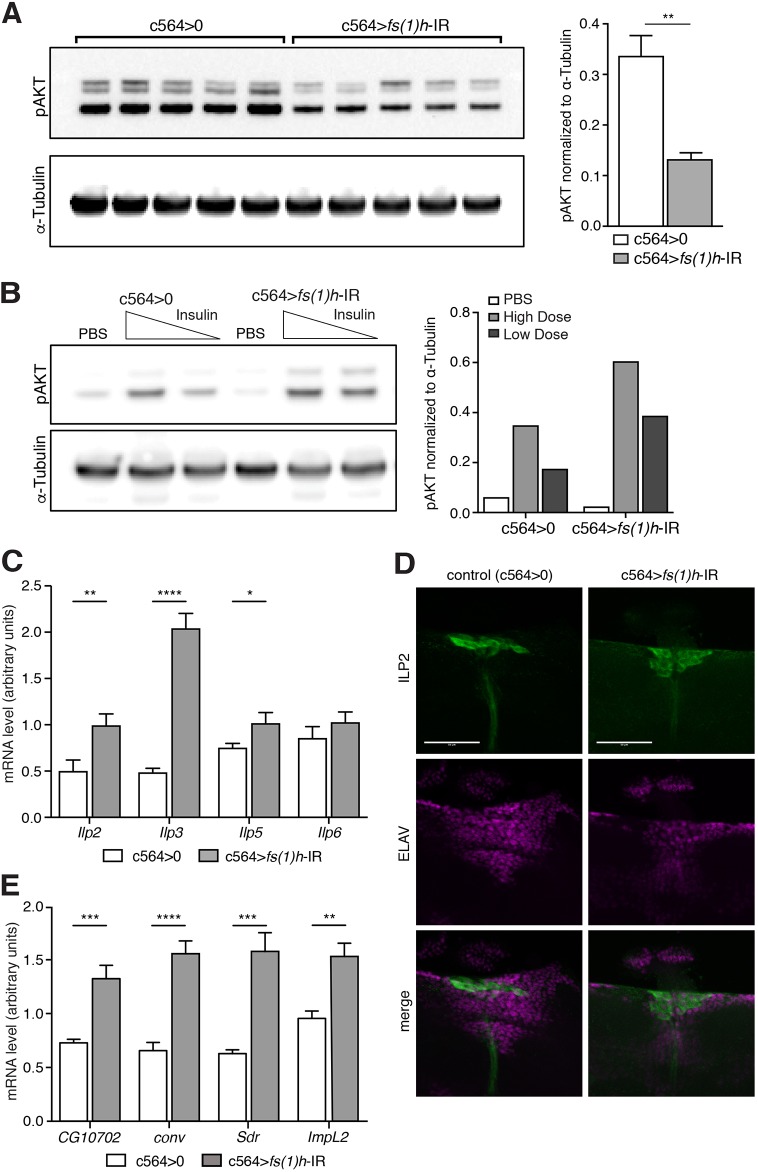
Fig. 2.
Fat body fs(1)h promotes AKT activity. (A) Western blot analysis of AKT Ser505 phosphorylation in control and fs(1)h fat-body-knockdown flies. Values represented as intensity relative to α-tubulin, shown as mean+s.e.m. (**P<0.01). (B) Western blot analysis of AKT Ser505 phosphorylation following injection with PBS or a high (320 pg/fly) or low (64 pg/fly) dose of human insulin, to assay insulin sensitivity. Values relative to α-tubulin, shown as mean. (C) Expression of Ilp2, Ilp3, Ilp5 and Ilp6 by qRT-PCR in whole control and fs(1)h fat-body-knockdown flies, shown as mean+s.e.m. Normalised to expression of α-tubulin as a loading control. (D) Immunostaining for ILP2 (green) and ELAV (magenta; labels all neurons; used as a counterstain). Scale bars: 50 μm. (E) Expression of CG10702, conv, Sdr and ImpL2 by qRT-PCR in whole control and fs(1)h fat-body-knockdown flies, shown as mean+s.e.m.; genotypes were compared using unpaired, two-tailed t-test. Normalised to expression of α-tubulin as a loading control. Ten samples per genotype. Throughout, *P<0.05, **P<0.01, ***P<0.001, ****P<0.0001.

