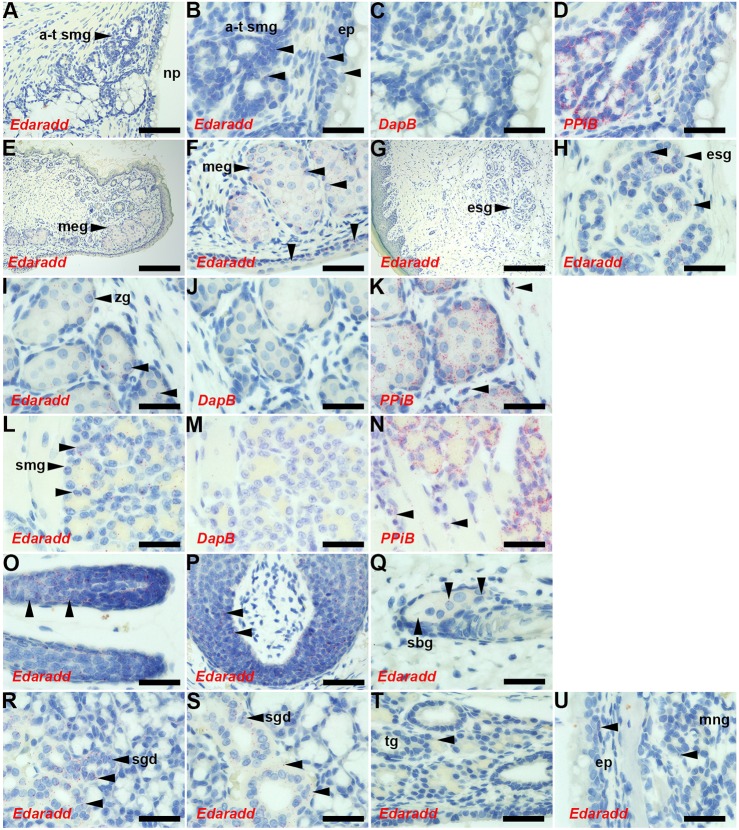
Fig. 5.
Expression of Edaradd in P10 and P13 rat tissues. (A-D,I-K,U) P10 Edaradd+/+ and (E-H,L-T) P13 Edaraddswh/+ tissues. ISH signals appear as red dots (unlabelled arrowheads in B,F,H,I,K,L,N-U), and the ISH probe is indicated in each panel. Edaradd expression is restricted to epithelia and glands; no signals are given with the negative control probe DapB. The positive control probe, PPiB, gives strong signals in connective tissue cell populations as well as epithelial tissues (arrowheads in K,N). Edaradd ISH signals (arrowheads) are seen in (B) auditory-tube SMG and epithelium (B-D are higher-power images of A); (E,F) Meibomian gland and conjunctiva epithelium; (G,H) footpad with eccrine sweat gland; (I-K) Zymbal's gland; (L-N) tongue SMG; (O) anagen hair follicle; (P) whisker hair follicle; and duct epithelium in (R) sublingual and (S) submandibular salivary glands. Edaradd ISH signals in (Q) sebaceous gland, (T) tracheal gland and (U) nasal respiratory epithelium and medial nasal gland are low. a-t smg, auditory-tube SMG; ep, epithelium; esg, eccrine sweat gland; meg, Meibomian gland; mng, medial nasal gland; np, nasopharynx; sbg, sebaceous gland; sgd, salivary gland duct; tg, tracheal gland; zg, Zymbal's gland. Scale bars: (G) 200 µm; (A,E) 100 µm; (P) 50 µm; (B-D,F-O,Q-U) 20 µm.

