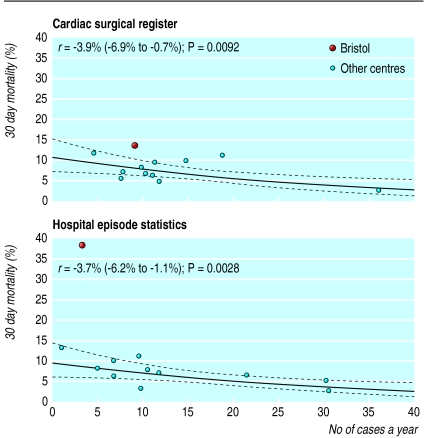
Figure 2.
Relation between mortality and volume of cases in corrective surgery for transposition of the great arteries in children aged <1 year, 1991-5 (hospital episode statistics show switch operations; the cardiac surgical register includes other types). r=estimated change (excluding data from Bristol) in odds of death for each extra case per year; p values are for a two sided test of the hypothesis of no association. Solid line shows the relation fitted by logistic regression, dashed lines show 95% confidence intervals (see appendix 2 for reasons for curved lines)

