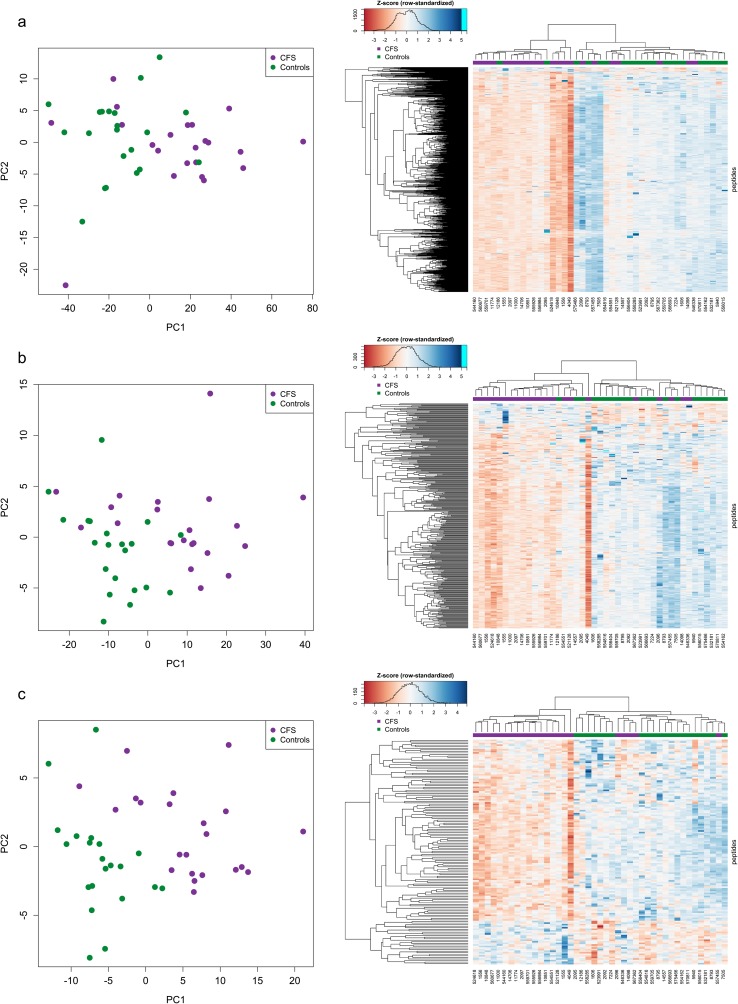
Fig. 2.
PCA projection (PC2 vs PC1) and unsupervised clustering (heatmap) results for the three peptide panels derived from supervised analyses on the Discovery Set of 43 Canadian ME/CFS and control samples (a RL_panel, b RF_panel, and c EN_panel). PCA plots and heatmaps are based on row-standardized data (Z-scores), where for each peptide, abundances had their mean value subtracted and were divided by the standard deviation

