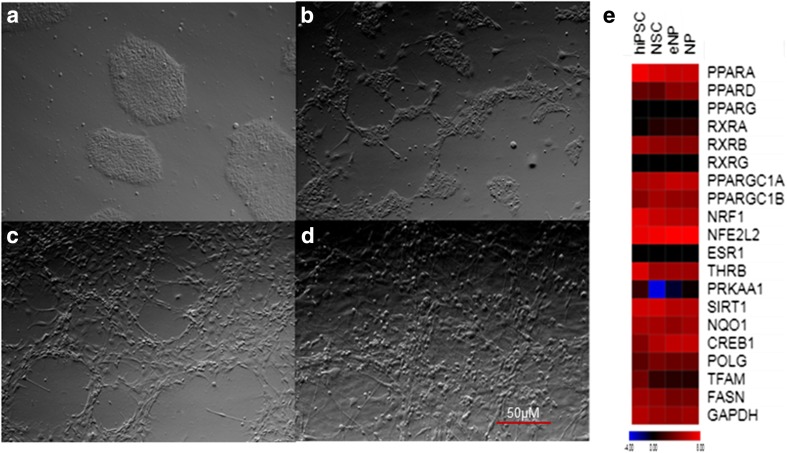
Fig. 2.
Comparison of the obtained cell populations at different stages of neural development. Phase-contrast images of cell morphology at iPSC (a), NSC (b), eNP (c), and NP (d). The heat map from RNA-Seq data (e) represents expression level of the selected genes involved in the PPARs and PGC1 alpha pathway at the hiPSC, NSC, eNP, and NP stages of development

