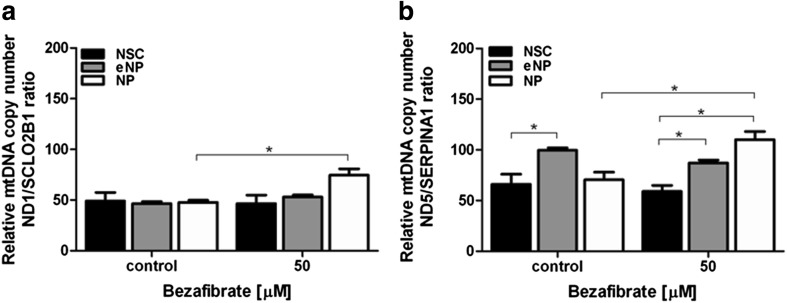
Fig. 5.
The relative mtDNA copy number was evaluated by the ratio of a ND1 to SCLO2B1, and b ND5 to SERPINA1 in NSC, eNP, and NP cell populations exposed to 5 days of BZ (50 μM). Brackets show statistical significance between samples vs. control (Student’s t) and comparison between groups (two-way ANOVA, Bonferroni’s post-test): (*), p < 0.05. Results shown in the brackets were obtained as mean (± SEM) and are presented as [%] of control

