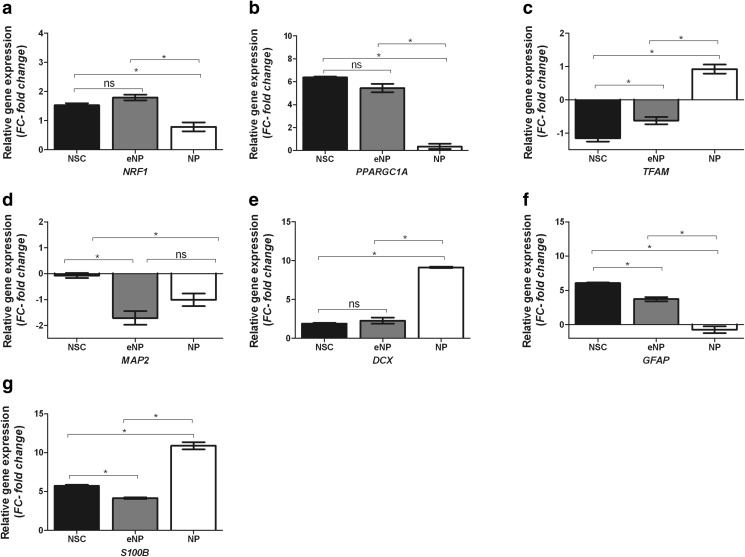
Fig. 7.
Relative gene expression (fold of changes vs. control) was determined in NSC, eNP, and NP cells after 5 days exposition to BZ (50 μM) by qRT-PCR methods. Relative gene expression was evaluated for key genes connected with regulation of mitochondrial biogenesis: a NRF1, b PPARGC1A, and c TFAM; neuronal: d MAP2 and e DCX; and astrocytic: e GFAP and f S100B differentiation. Results presented in the brackets are represented as the mean value (± SEM). Brackets show statistically significant differences between NSC, eNP, and NP obtained with one-way ANOVA with Tukey’s post-test: (*), p < 0.05

