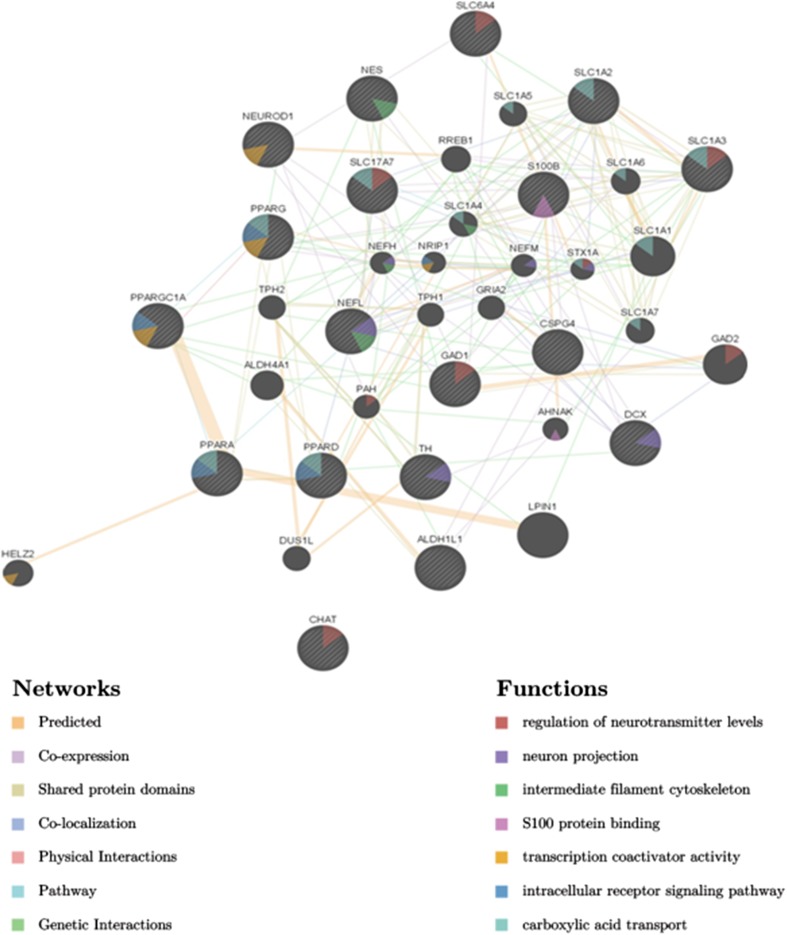
Fig. 8.
Modeling in silico the interaction between selected genes involved in PGC-1α pathway and neuronal differentiation. The in silico analysis of function and interaction between PPAR receptors (PPARA, PPARD, PPARG), coactivator PAPRGC1A gene and neural (NES), neuronal (DCX, NEFL, NEFM, NEFH), neuronal subtypes (TH, CHAT, SLC17A7, SLC1A1, GAD1, SLC6A4), as well as astrocyte (ALDH1L1, SLC1A3, SLC1A2, S100B) and oligodendrocyte (CSPG4) markers was performed in the Genemania web tool (https://genemania.org/) to show the networks of interaction between the selected genes (cytoscape). The in silico evaluation present function of analyzed genes and network of interactions between them. Within the function category, analyzed genes were divided into the following groups: neuron projection (NEFH, NEFM, BEFL, DCX, TH); intermediate filament cytoskeleton (NES, NEFH, NEFL); intracellular receptor signaling pathway (PPARA, PPARD, PAPRG, PPARGC1A); S100B protein binding (S100B); regulation of neurotransmitter level (CHAT, SLC17A7, SLC1A3, SLC6A4, GAD1); carboxylic acid transport (PPARA, PPARG, PAPRD, SLC1A3, SCL17A7, SLC1A1, SLC1A2). Within the network category analyzed genes were divided, based on the type of interaction, to the following groups: physical interaction (1.41%), prediction (63.88%), genetic interaction (0.33%), shared protein domains (12.06%), co-localization (3.71%), co-expression (17.75%), and pathway (0.86%)

