Fig. 3.
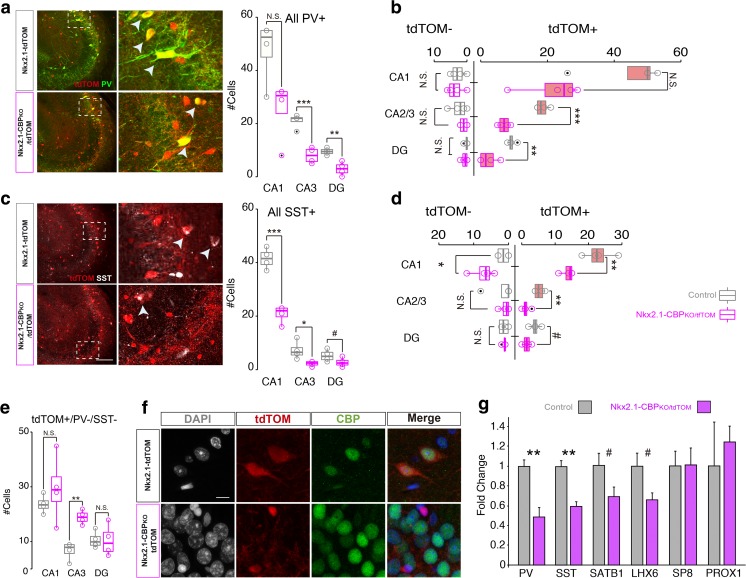
Subtype-specific characterization of MGE-derived interneurons. a Representative image of the hippocampus employed for quantification of PV+ cells (left) and quantification of all PV+ cells regardless of tdTOM expression (right). b Separate quantification of tdTOM positive and negative PV+ cells. PV+ cells that are not derived from the MGE (i.e., PV+, tdTOM-) are unaffected in CBP-deficient mice (CA1, t6 = 0.43, p = 0.68, unpaired t test, d = 0.31; CA3, U = 5, p = 0.47, Mann-Whitney U, A = 0.31; DG, U = 10.5, p = 0.51, Mann-Whitney U, A = 0.66). However, MGE-derived PV+ interneurons (PV+, tdTOM+) were diminished in Nkx2.1-CBPKO/tdTOM mice (CA1, U = 2, p = 0.11, Mann-Whitney U, A = 0.13; CA3, t6 = − 8.69, p = 0.001, unpaired t test, d = − 6.15; DG, t6 = − 4.46, p = 0.004, paired t test, d = − 6.15). c Representative images for quantification of SST+ cells (left, same fields as in panel A) and quantification of all SST+ cells regardless of tdTOM expression (right). Scale bar: 100 μm. d Separate quantification of tdTOM positive and negative SST+ cells. We did not find differences in SST+ cells born outside the MGE (i.e., SST+, tdTOM-) at the CA3 (U = 7, p = 0.87. Mann-Whitney U, A = 0.44) and DG (t6 = − 0.07, p value = 0.94, unpaired t test, d = 0.05) subfields of CBP-deficient mice. However, the CA1 subfield shows a significantly larger number of SST+ cells (U = 16, p = 0.02. Mann-Whitney U, A = 1). e Quantification of the number of tdTOM+ cells that do not express the proteins PV or SST proteins in Nkx2.1-CBPKO/tdTOM and Nkx2.1-tdTOM mice. There is a statistically significant difference in the CA3 subfield (t6 = − 5.84, p value = 0.001, unpaired t test, d = − 4.13). f Representative images of tdTOM+/PV-/SST- cells in the CA3 subfield of Nkx2.1-CBPKO/tdTOM and Nkx2.1-tdTOM mice. Scale bar: 10 μm. g RT-qPCR assays for the indicated genes using total RNA isolated from the hippocampus of Nkx2.1-CBPKO and control littermates. Statistical differences were found for Pvalb (PV) (t5 = 3.95, p = 0.01, unpaired t test) and Sst (SST) (t5 = 5.49, p = 0.01, unpaired t test) expression, as well as a clear trend in Satb1 (SATB1) (t5 = 2.05, p = 0.09, unpaired t test) and Lhx6 (LHX6) (t5 = 2.34, p = 0.07, unpaired t test). We observed in these four genes large effects size. #P < 0.1; *P < 0.05; **P < 0.01; ***P < 0.001

