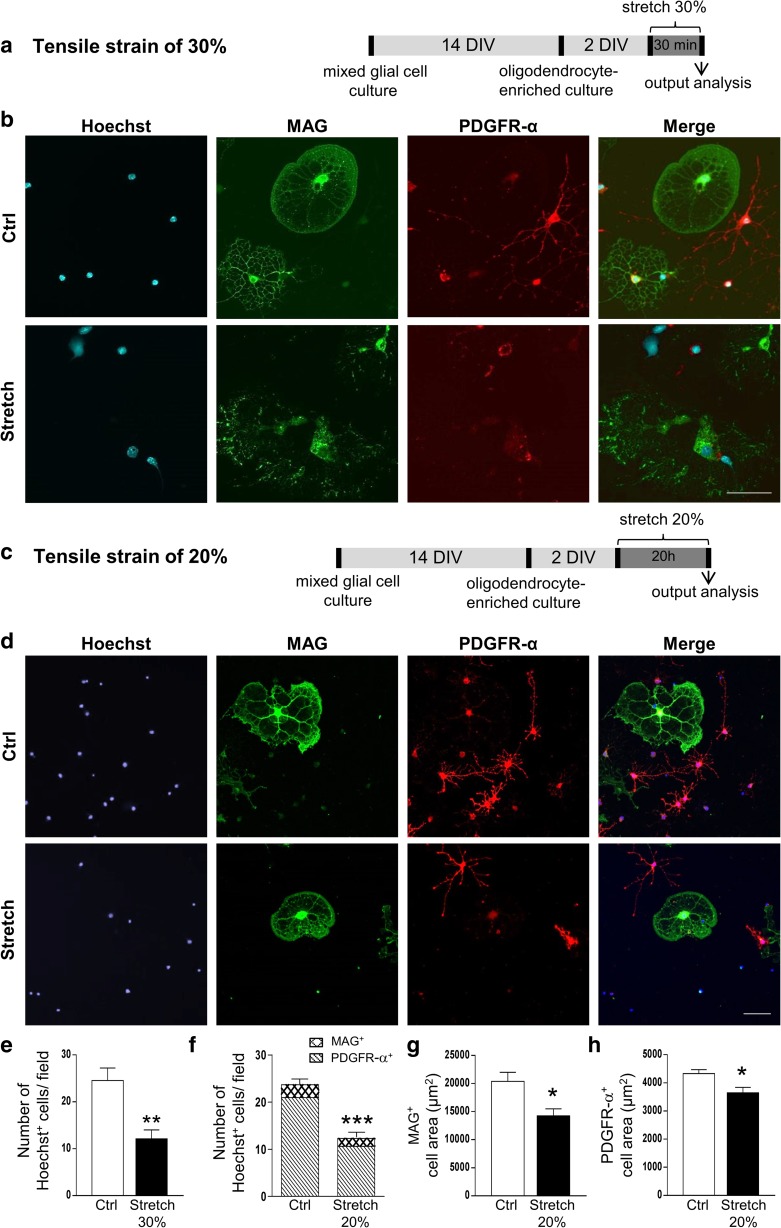
Fig. 3.
Oligodendrocyte morphology and cell adhesion after in vitro mechanical tensile strain of 20% and 30%. a, c In vitro culture and strain model protocol of oligodendrocyte-enriched primary culture for mechanical strain of 30% and 20%, respectively. b, d Immunostaining of mature oligodendrocytes (MAG in green), their precursors (PDGFR-α in red), and nuclei (Hoechst in blue) in control (Ctrl) and stretched (Stretch) cells after mechanical strain of 30% and 20%, respectively. Scale bar, 100 μm. e Quantitative analysis of the number of Hoechst+ cells per field (0.26 nm2) after 30% of strain. f Quantitative analysis of the number of Hoechst+ cells per field (0.26 nm2) and of the percentage of MAG+ and PDGFR-α+ cells after 20% of strain. g, h Quantitative analysis of the area of MAG+ cells (g) and PDGFR-α+ cells (h) after 20% of strain. Results represent the mean ± SEM (n = 3). *p < 0.05; **p < 0.01; ***p < 0.001. DIV days in vitro

