Fig. 6.
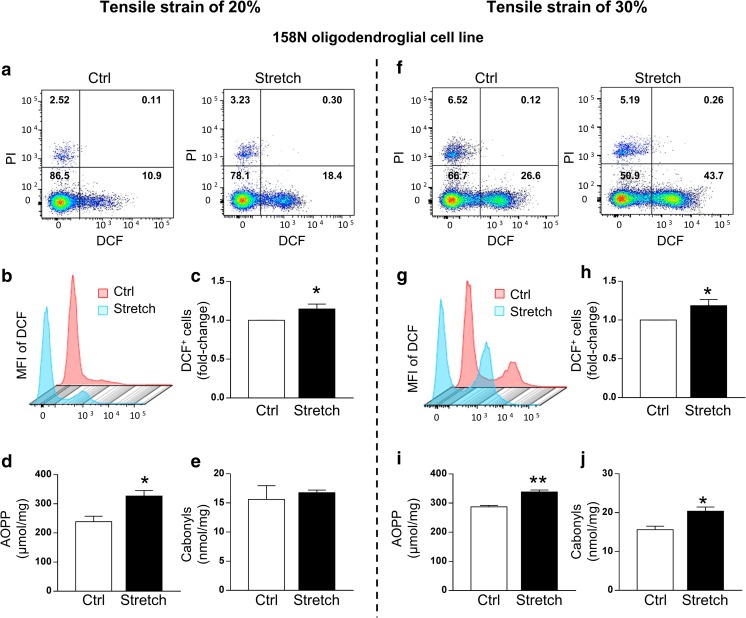
Stretch increases the level of intracellular ROS in the 158N cell line after tensile strain of 20% and 30%. The intracellular ROS level was detected by the DCFH-DA fluorescent probe. Representative DCF-stained (FITC channel) and PI-stained (PE channel) pictures of control (Ctrl) and stretched (Stretch) cells following strain of 20% (a) and 30% (f). Representative picture of the mean fluorescence intensity (MFI) of DCF measured in DCF+/PI− cells following strain of 20% (b) and 30% (g). Quantitative analysis of the percentage of DCF+ cells following strain of 20% (c) and 30% (h). Results are expressed as the fold change in comparison to the control group. Values are the mean ± SEM of three experiments performed in triplicate. AOPP (μmol/L) and carbonyls (nmol/mg) were measured in control (Ctrl) and stretched (Stretch) cells following 20% (d, e) and 30% (i, j) of strain. Results represent the mean ± SEM (n = 5). *p < 0.05; **p < 0.01. DCF 2′,7′ fluorescent dichlorofluorescein. PI propidium iodide

