Figure 1.

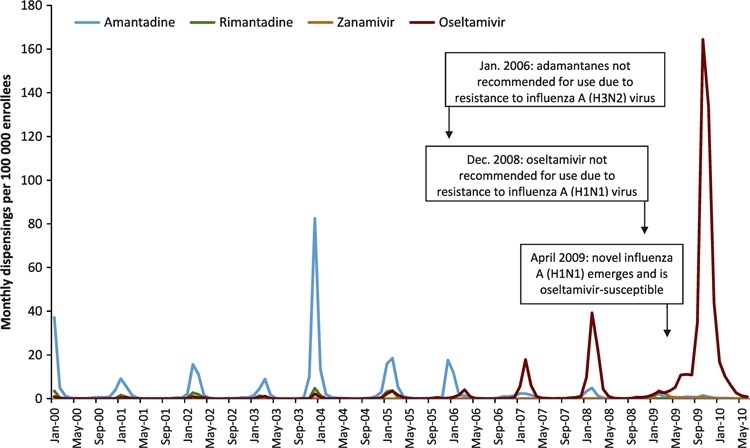
Monthly influenza antiviral dispensing rates for treatment purposes, by medication, Vaccine Safety Datalink Project, January 2000 through June 2010. The type and timing of changes in national treatment guidelines are indicated.

Monthly influenza antiviral dispensing rates for treatment purposes, by medication, Vaccine Safety Datalink Project, January 2000 through June 2010. The type and timing of changes in national treatment guidelines are indicated.