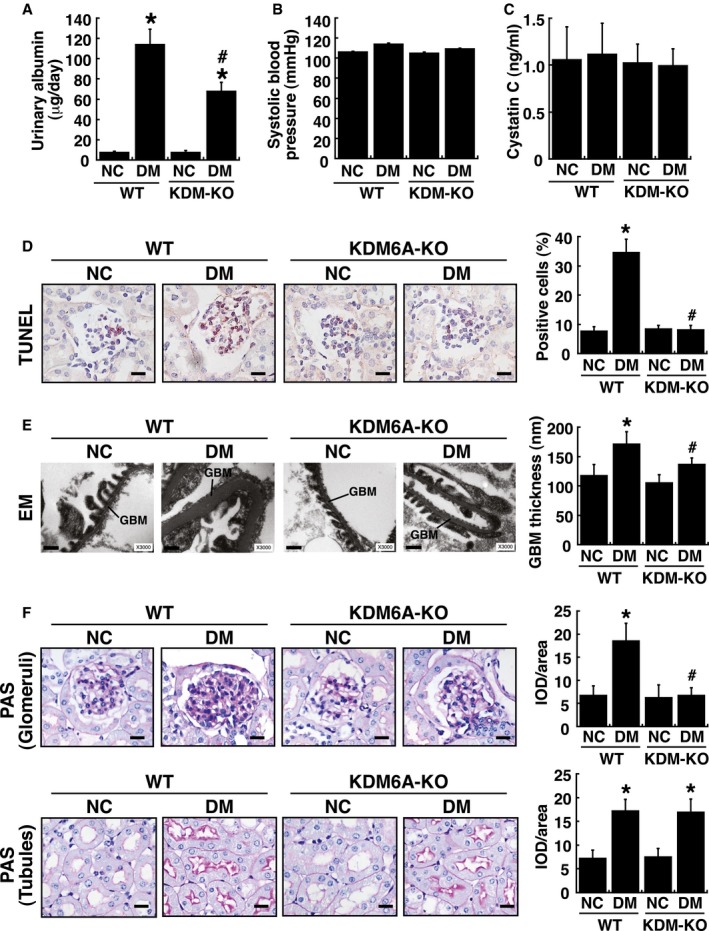
Figure EV1. In vivo analysis of wild‐type and podocyte‐specific KDM6A knockout (KDM6A‐KO) mice with or without STZ treatment.

-
AUrinary albumin excretion in wild‐type and KDM6A‐KO mice with or without STZ treatment. Urinary albumin levels were determined with a turbidimetric immunoassay (Autokit Micro Albumin, Wako, Osaka, Japan) at 8 weeks after diabetic induction. *P < 0.05 versus untreated wild‐type mice, # P < 0.05 versus STZ‐treated wild‐type mice (parametric ANOVA and a Bonferroni post hoc test; n = 8).
-
BSystolic blood pressure of wild‐type and KDM6A‐KO mice with or without STZ treatment. Systolic blood pressure was measured by tail–cuff plethysmography (BP‐2000 Series II Blood Pressure Analysis System, Visitech Systems, Apex, NC, USA) at 8 weeks after diabetic induction. There were no statistical differences in mean systolic blood pressures between groups (parametric ANOVA and a Bonferroni post hoc test; n = 8).
-
CLevels of urinary cystatin C of wild‐type and KDM6A‐KO mice with or without STZ treatment. Urine cystatin C was measured using an ELISA kit (MSCTC0, R&D Systems) at 8 weeks after diabetic induction. No statistical differences in levels of urinary cystatin C were found between groups (parametric ANOVA and a Bonferroni post hoc test; n = 8).
-
DDetection of glomerular cell apoptosis in wild‐type and KDM6A‐KO mice with or without STZ treatment. TUNEL assay for apoptosis was performed using an assay kit according to the manufacturer's instruction (#TAAP01D, BioTnA Biotech., Kaohsiung Taiwan). Scale bars, 20 μm. *P < 0.05 versus untreated wild‐type controls, # P < 0.05 versus STZ‐treated wild‐type mice (parametric ANOVA and a Bonferroni post hoc test; n = 3).
-
ERepresentative electron micrographs of glomerular basement membrane (GBM) thickening and foot process effacement in wild‐type and KDM6A‐KO mice with or without STZ treatment. Kidney specimens for electron microscopy were prepared using a standard protocol described previously (White & Bilous, 2000; Advani et al, 2007), and electron micrographs were taken with a FEI Tecnai G2 F20 S‐TWIN Transmission Electro Microscope (TEM). TEM images were processed and analyzed with DigitalMicrograph (Gatan Inc.). Scale bars, 0.5 μm. *P < 0.05 versus untreated wild‐type controls, # P < 0.05 versus STZ‐treated wild‐type mice (parametric ANOVA and a Bonferroni post hoc test; n = 3).
-
FRepresentative photographs of periodic acid–Schiff (PAS) staining of kidney tissues from wild‐type and KDM6A‐KO mice with or without STZ treatment. Scale bars, 20 μm. Levels of PAS staining in kidneys were quantified by integrated optical density (IOD) analysis. *P < 0.05 versus untreated wild‐type controls, # P < 0.05 versus STZ‐treated wild‐type mice (parametric ANOVA and a Bonferroni post hoc test; n = 3). As noted, diabetic KDM6A‐KO mice revealed reduced PAS‐staining intensity in renal glomeruli, but not in renal tubules, as compared to diabetic wild‐type mice.
