-
A
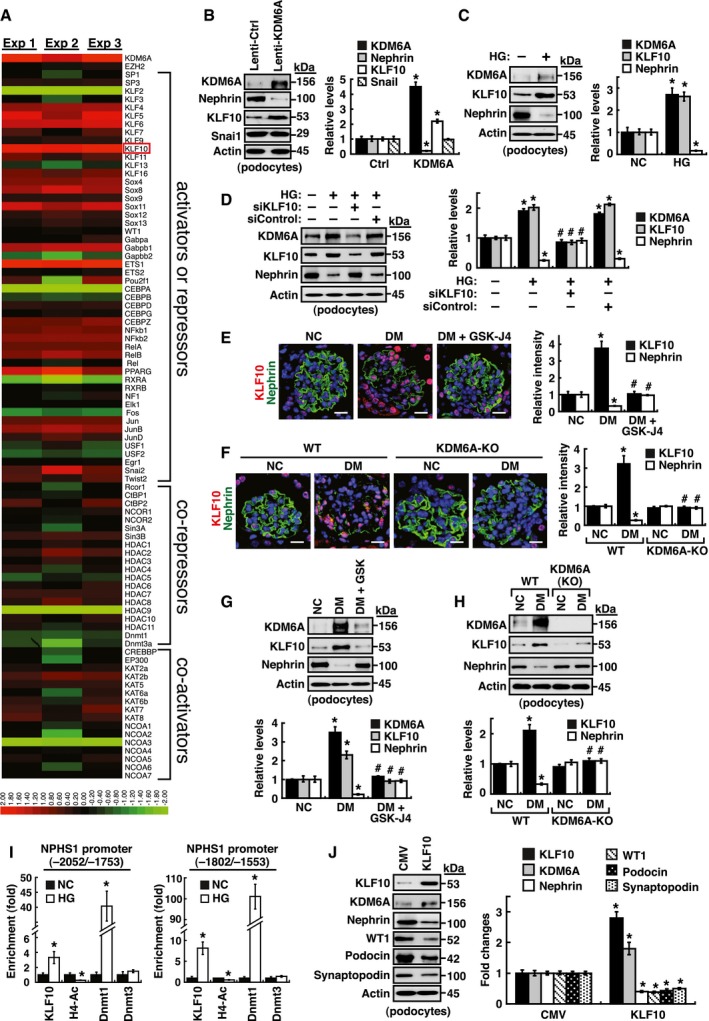
Screening of the potential KDM6A‐regulated transcriptional factors involved in repression of nephrin expression. After transduction with a control lentiviral vector or a lentiviral vector expressing KDM6A into primary podocytes for 48 h, intracellular RNAs were isolated and used for RNA sequencing (RNA‐Seq) analysis. The transcript expression patterns of 86 selected transcriptional factors from three independent RNA‐Seq experiments are presented in a heat map. Notably, among these 86 selected genes, KLF10 is the most up‐regulated gene.
-
B
Validation of increased KDM6A and KLF10 expression in primary podocytes that were infected with an empty lentiviral vector or KDM6A‐expressing lentiviral vector for 48 h. *P < 0.05 versus the empty vector control (Wilcoxon two‐sample test; n = 3).
-
C
Increased expression of KDM6A and KLF10 in primary podocytes cultured in high glucose for 48 h. *P < 0.05 versus normal controls (Wilcoxon two‐sample test; n = 3).
-
D
Effect of KLF10 knockdown on high glucose‐mediated reduction of nephrin in primary podocytes. As noted, knockdown of KLF10 prevented down‐regulation of nephrin and up‐regulation of KDM6A in high glucose‐treated podocytes. *P < 0.05 versus normal controls, #
P < 0.05 versus control siRNA with HG incubation (parametric ANOVA and a Bonferroni post hoc test; n = 3).
-
E
Immunofluorescence analysis of KLF10 and nephrin in renal sections of normal, diabetic, and GSK‐J4‐treated diabetic mice. Scale bars, 20 μm. *P < 0.05 versus the normal control group, #
P < 0.05 versus the untreated diabetic group (parametric ANOVA and a Bonferroni post hoc test; n = 3).
-
F
Immunofluorescence images of KLF10 and nephrin in renal sections of wild‐type or KDM6A‐KO mice with or without STZ treatment. Scale bars, 20 μm. *P < 0.05 versus the untreated wild‐type group, #
P < 0.05 versus the STZ‐treated wild‐type group (parametric ANOVA and a Bonferroni post hoc test; n = 3).
-
G
Western blot analysis of KDM6A, KFL10, and nephrin expression in primary podocytes isolated from normal, diabetic, and GSK‐J4‐treated diabetic mice. *P < 0.05 versus normal controls, #
P < 0.05 versus the untreated diabetic group (parametric ANOVA and a Bonferroni post hoc test; n = 3).
-
H
Western blot analysis of KDM6A, KLF10, and nephrin expression in primary podocytes isolated from wild‐type or KDM6A‐KO mice with or without STZ treatment. *P < 0.05 versus the untreated wild‐type group, #
P < 0.05 versus the STZ‐treated wild‐type group (parametric ANOVA and a Bonferroni post hoc test; n = 3).
-
I
ChIP analysis of KLF10, acetyl‐histone H4 (H4‐Ac), Dnmt1 and Dnmt3 binding to nephrin gene promoter. ChIP assays were carried out using cross‐linked chromatin from primary podocytes that were cultured in normal or high glucose conditions. *P < 0.05, significant difference versus the normal control group (Wilcoxon two‐sample test; n = 3).
-
J
Modulation of podocyte‐specific marker expression in primary podocytes by KLF10 overexpression. Ectopic overexpression of KLF10 in primary podocytes significantly repressed various podocyte‐specific markers, but conversely increased KDM6A expression. *P < 0.05 versus the empty vector control (Wilcoxon two‐sample test; n = 3).
Data information: Data are expressed as mean ± SEM. See the exact
.

