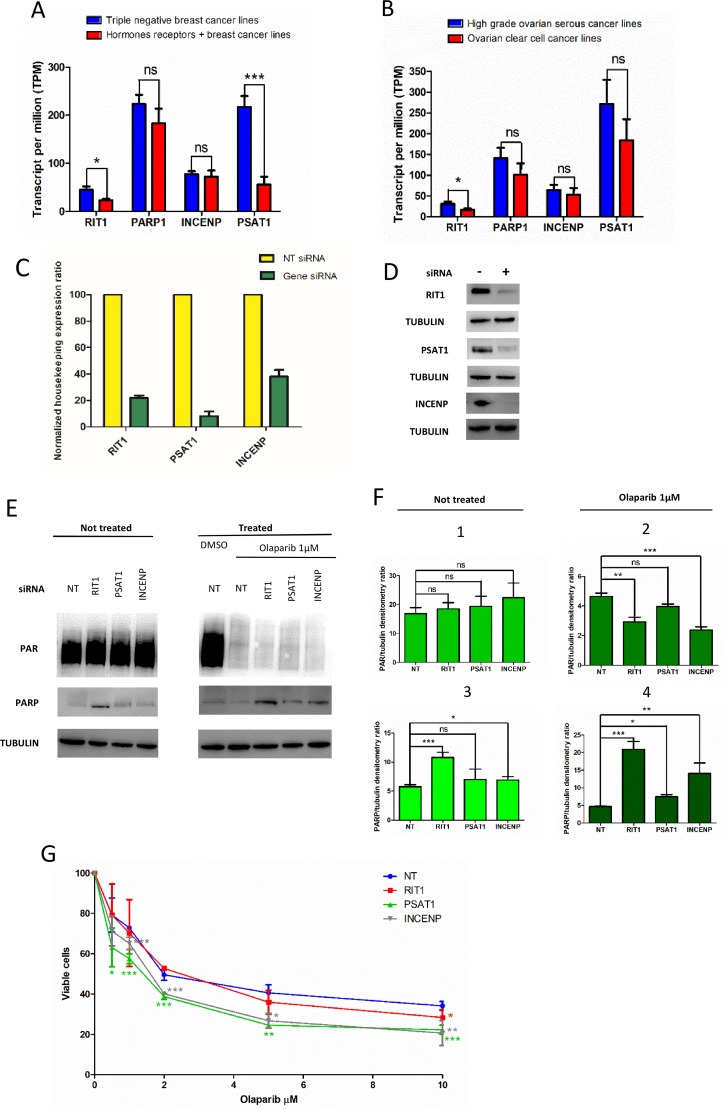
Figure 3. Effect of RIT1, INCENP and PSAT1 on PARylation and PARP1 protein level, and olaparip sensitivity.
(A) Expression of INCENP, RIT1 and PSAT1 in triple negative and hormone receptor positive (+) breast cancer cell lines: (B) Expression of INCENP, RIT1 and PSAT1 in high grade serous and ovarian clear cell cancer lines. Data were compared and statically analyzed by Student's t-test as indicated: ns, not significant, *p<0.05, ***p<0.001. (C) Expression level measured by qRT-PCR of total RNA extracted from siRNA-transfected cells. Results are the mean of 3-4 experiments ± SD. (D) Western blot analysis of total protein extracts from MCF7 cells transfected with siRNA. Each lane was loaded with 30μg of protein as reported in Materials and Methods. Primary and secondary antibodies are described in the Materials and Methods. Tubulin was evaluated as loading control. (E) PARylation and PARP1 level in cell transfect with siRNA and treated with the PARP inhibitor “olaparib”. Western blot analysis of total protein extracts from siRNA-transfected MCF7 cells to measure PARylation and PARP1 level in olaparib not-treated (left) and treated (right) cells. Each lane was loaded with 30μg of protein as reported in Materials and Methods. Antibodies are described in the Materials and Methods. Tubulin was evaluated as loading control. (F) Densitometry was carried out by direct normalization on tubulin level. In panels 1 and 2, data on PARylation level are shown; in panels 3 and 4, data on PARP1 protein level. Panels 1 and 3 are referred to not-treated cells, panels 2 and 4 to olaparib-treated cells. Results are the mean of 3-4 experiments ± SD. Statistical analysis was performed using the Student's t-test; ns, not significant, *p< 0.05, **p< 0.01, ***p< 0.001. (G) Effect on RIT1, INCENP and PSAT1 on olaparib sensitivity in MCF7 cells. Cells are transfected with specific siRNA and after 6 hours re-plated in presence of different doses of olaparib (0, 5, 1, 2, 5, 10 μM) or DMSO. After 48 hours cell viability is calculated as described in Materials and Methods. Results are reported as mean of 3-4 experiments ± SD. Statistical analysis was performed using the Student's t-test by comparing data from siRNA-not-transfected (NT) to siRNA-transfected cells; *p< 0.05, **p< 0.01, ***p< 0.001.

