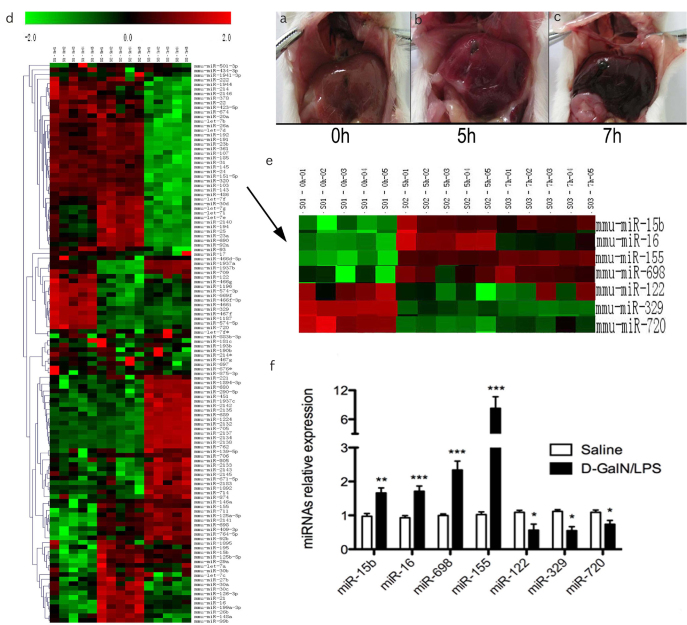
Figure 1. a–f.
Microarray analysis of hepatic miRNAs expression in ALF
In our previous experiment, we have reported the histopathology changes of liver after D-GalN/LPS induction. Generally, the surface of normal liver looked smooth (A) (n = 10), 5 h after D-GalN/LPS challenged, the color of surface became deepened and it was spotting (B) (n = 10), Extreme damage of liver tissues was checked at 7 h (C) (n = 10), the liver was swelling, and the liver surface had a severe congestion. The expression profile of hepatic miRNA was detected using the LAN-based miRNA microarray in mice at 0, 5 and 7 h post D-GalN/LPS treatment. It was revealed that there were 122 deregulated hepatic miRNAs (P< 0.01) in ALF mice compared to the control (saline group; 0 h) (D) n = 5 for each time point. The miRNAs with more significant changes were showed as the arrow indicated, the top bar represents the signal levels of miRNA expression from −2 (green) to +2 (red) (E), n = 5 for each time point. The up-regulation of miR-15b, miR-16, miR-155 and miR-698 and down-regulation of miR-122, miR-329 and miR-720 were verified by RT-PCR (F) (n = 10).

