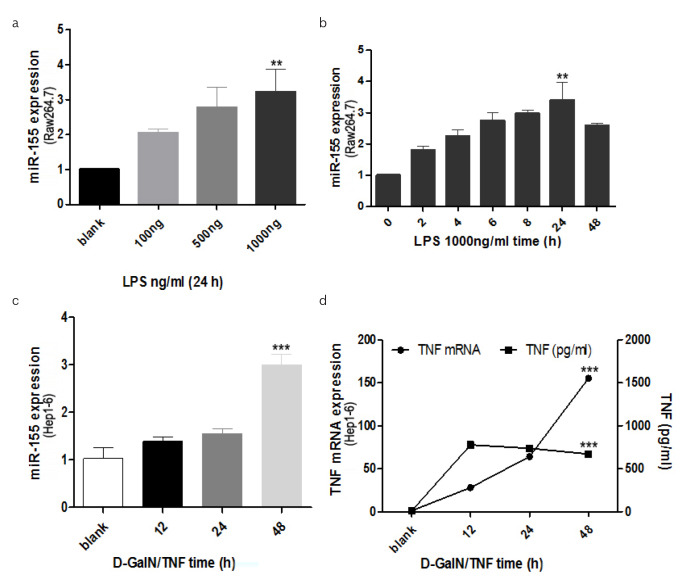
Figure 5. a–d.
miR-155 expression in both RAW264.7 and Hep1-6 cells
RAW264.7 cell was induced with LPS, miR-155 was detected with different concentration at 24 h post LPS induction (A) and at different time points with the concentration of 1000ng/ml using RT-PCR (B). miR-155 expression was detected with RT-PCR when the Hep1-6 cells were induced with D-GalN/TNF at several time points (C). TNF mRNA as well as the TNF protein levels in supernatant of Hep1-6 cells with D-GalN/TNF treatment at different time point were detected by RT-PCR and ELISA, respectively (D).

