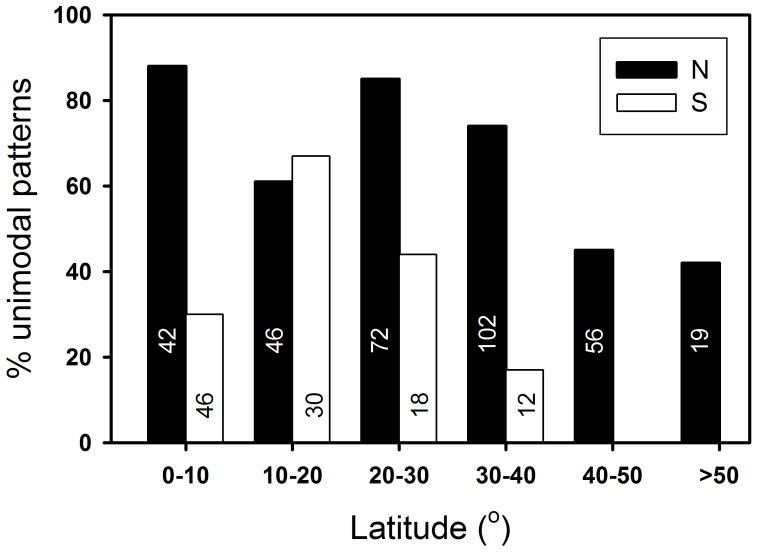
Figure 3. Distribution of examined diversity gradients with unimodal pattern across latitudes in both Northern and Southern hemispheres.
The number in each bar represents the no. of gradients in each category. Except for the “1–10°N” category in Northern Hemisphere, mid-latitudes had more gradients with unimodal pattern.

