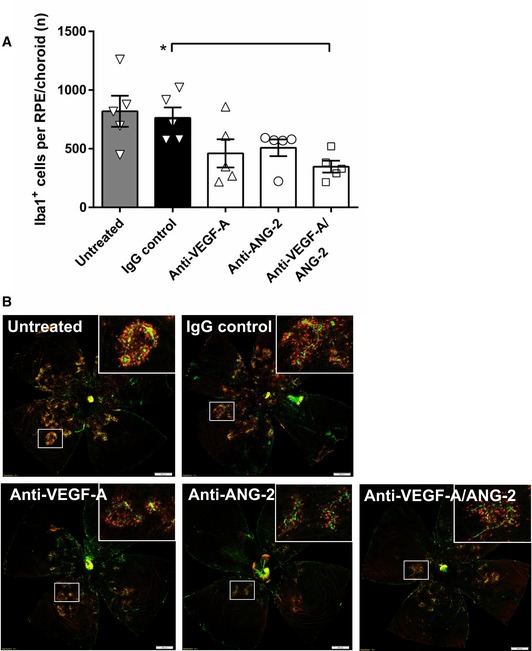
Figure 2. Combined neutralization of VEGF‐A and ANG‐2 reduced the number of Iba1+ macrophages in the JR5558 mice.

(A) Bar/scatter graph of the number of Iba1+ cells in the subretinal space of mice treated with 10 mg/kg IgG control, 5 mg/kg anti‐VEGF‐A, 5 mg/kg anti‐ANG‐2, 10 mg/kg anti‐VEGF‐A/ANG‐2, or left untreated. Data are shown as mean ± SEM with n = 5 animals per group, and asterisk denotes significant changes after one‐way ANOVA and Tukey's multiple t‐test (Tukey–Kramer HSD). Anti‐VEGF‐A/ANG‐2 is significantly different from IgG control (*P < 0.02). (B) Representative examples of flat‐mounted RPE/choroid Iba1 (red) and IB4 counterstain (green) of untreated (top left), IgG control (top middle; 10 mg/kg), anti‐VEGF‐A (bottom left; 5 mg/kg), anti‐ANG‐2 (bottom middle; 5 mg/kg), and anti‐VEGF‐A/ANG‐2 (bottom right; 10 mg/kg). Adjustment of brightness to 100 using Photoshop CS6 was applied equally to all images, and non‐tissue background was removed using Lasso tool. Inserts show selected areas. Scale bars = 500 μm. SEM, standard error of the mean; ANOVA, analysis of variance.Source data are available online for this figure.
